Management by Exception
The less you have to interact with a running flow, the stronger it is. The development of a ‘happy flow’ is often quite easy, but also just the beginning of a successful integration. We are only human after all and should acknowledge that our work is full of mistakes, wrong assumptions and shortcomings.
“All humans make mistakes. What determines a person's character aren't the mistakes we make.
It's how we take those mistakes and turn them into lessons rather than excuses.”
― Colleen Hoover, It Ends with Us
And even if you would develop flawless integrations you’ll see that sometimes endpoints react unexpectedly or not at all.
Therefore a good practice is to monitor your flows with ‘Management by Exception’, handle recurring exceptions within your integrations and follow an iterative development process to (re)act appropriately. This guide will show you how to “take those mistakes and turn them into lessons” in flows.
1. Goal of this guide
The goal of this guide is to show you how to develop your integrations in a way that exceptions can be monitored in one dataset and/or handled right away. This gives you a birds eye view over multiple running integrations, focusing your attention on the areas where it matters most, the deviation of the mean / the expected.
1.1 Good practices
We have defined 4 good practices for Management by Exception:
- 3. Error Route Monitoring (ERM)
Monitor messages that end up in the Error Route and log them in a single location. - 4. Define the expected response
Define the response you expect, and therefore the exceptions, of an endpoint. - 5. Flow Function Monitoring (FFM)
Monitor flow function exceptions and log them in a single location. - 6. Error handling
Handle recurring erroneous responses directly in your flow.
1.2 Scope
In this guide we will focus on HTTP calls, but these good practices are translatable to other types of endpoints and/or components i.e. FTP. Each will have their own methods of communicating the status of your request.
Data validation, i.e. with XSL(T), is outside of the scope of this guide.
1.3 Prerequisites
- Version 4.15.0 instance (minimum) with the Management by Exception example flow below installed
- SQL database:
- Make sure you have the following database info / credentials:
- host
- database name
- username
- password
- port
- See 8.3 Create SQL database for queries to create and test the database table
- Make sure you have the following database info / credentials:
- Basic knowledge of sending HTTP requests with Postman
1.4 Downloads
Right click, save link as.
2. Monitoring & Error Handling
After the development of your flow most messages between components are already free from errors ‘by design’. You’ve developed, tested and debugged your flow’s functionality. During this process you have solved errors, poor interactions and other issues that surfaced. When you are ready to put your flow into production your integration is ‘permanently arranged’, meaning: there is a set route with a set amount of predefined steps.
The biggest challenge now is how to handle exceptions while your integration is up and running. These deviations occur where variables are introduced that are unaccounted for, for instance in communication.
Some examples:
- An FTP server is not available when you try to get a file from it
- You send a HTTP request to a server that responds with an error code or no response at all
- There are unexpected values or value types in a data source
- Data is running through the flow more frequently, resulting in ‘over asking’ an endpoint
- Datasets are growing in size over time, causing performance issues
2.1 Management by Exception
Often exceptions are not directly related to the performance as an Integration Platform. They reveal blind spots in your design & development process and show progressive insights into previously unknown areas of your integration. It shows the importance of monitoring which increases your awareness and understanding so you can improve and learn. Ultimately making your integrations stronger and less dependent. We call this ‘Management by Exception’ and it underlines the need for an iterative development process. Management by Exception gives you the opportunity to and benefits of monitoring multiple integrations in one dataset.
2.1.1 Technical vs. Functional exceptions
It’s hard to define the line between a technical and a functional exception. In general technical exceptions originate from the ‘performance’ of technologies used and have the potential to terminate an integration completely. Functional exceptions in general originate from business rules, data quality and/or the ‘function’ of a flow. You can imagine there’s a big grey area in between.
Technical Exceptions
A technical exception is an event that goes wrong because of a technical error. Technical exceptions can terminate the continuation of a flow. Often they are pretty easy to find, they end up in the Error Route as a failed exchange or in the Flow Manager logs. They can have a specific exception header, message or body pointing towards the origin of the error.
Monitoring the Error Route of your flow acts as a catchall for any exchanges between components that failed in your integration.
Functional Exceptions
Functional exceptions are more related to the content of your integration and to a lesser extent about the technology. Their origin can be as easy to spot as technical exceptions because they communicate similar error messages as a technical error. For instance a 401 error indicating your credentials are outdated or a ‘400 bad request’ error when you try to post data to an endpoint.
But they can also go under the radar and then they are more difficult to spot. For instance you sent a get request to an HTTP endpoint:
- It sends back an error response, but you have not defined the expected response
- Unwillingly your flow continues and uses the response to set a header with XPath
(it gets set to ‘null’ because the data you expect to be there actually is not) - Then you post a request to another endpoint that using this header value and your data doesn’t get posted
While analysing these kinds of exceptions the culprit seems to be the 2nd request at first sight, while actually the error originated much earlier. In this guide we show you how to define the expected response to prevent this, how to monitor the function of flows and how to handle recurring exceptions as they occur.
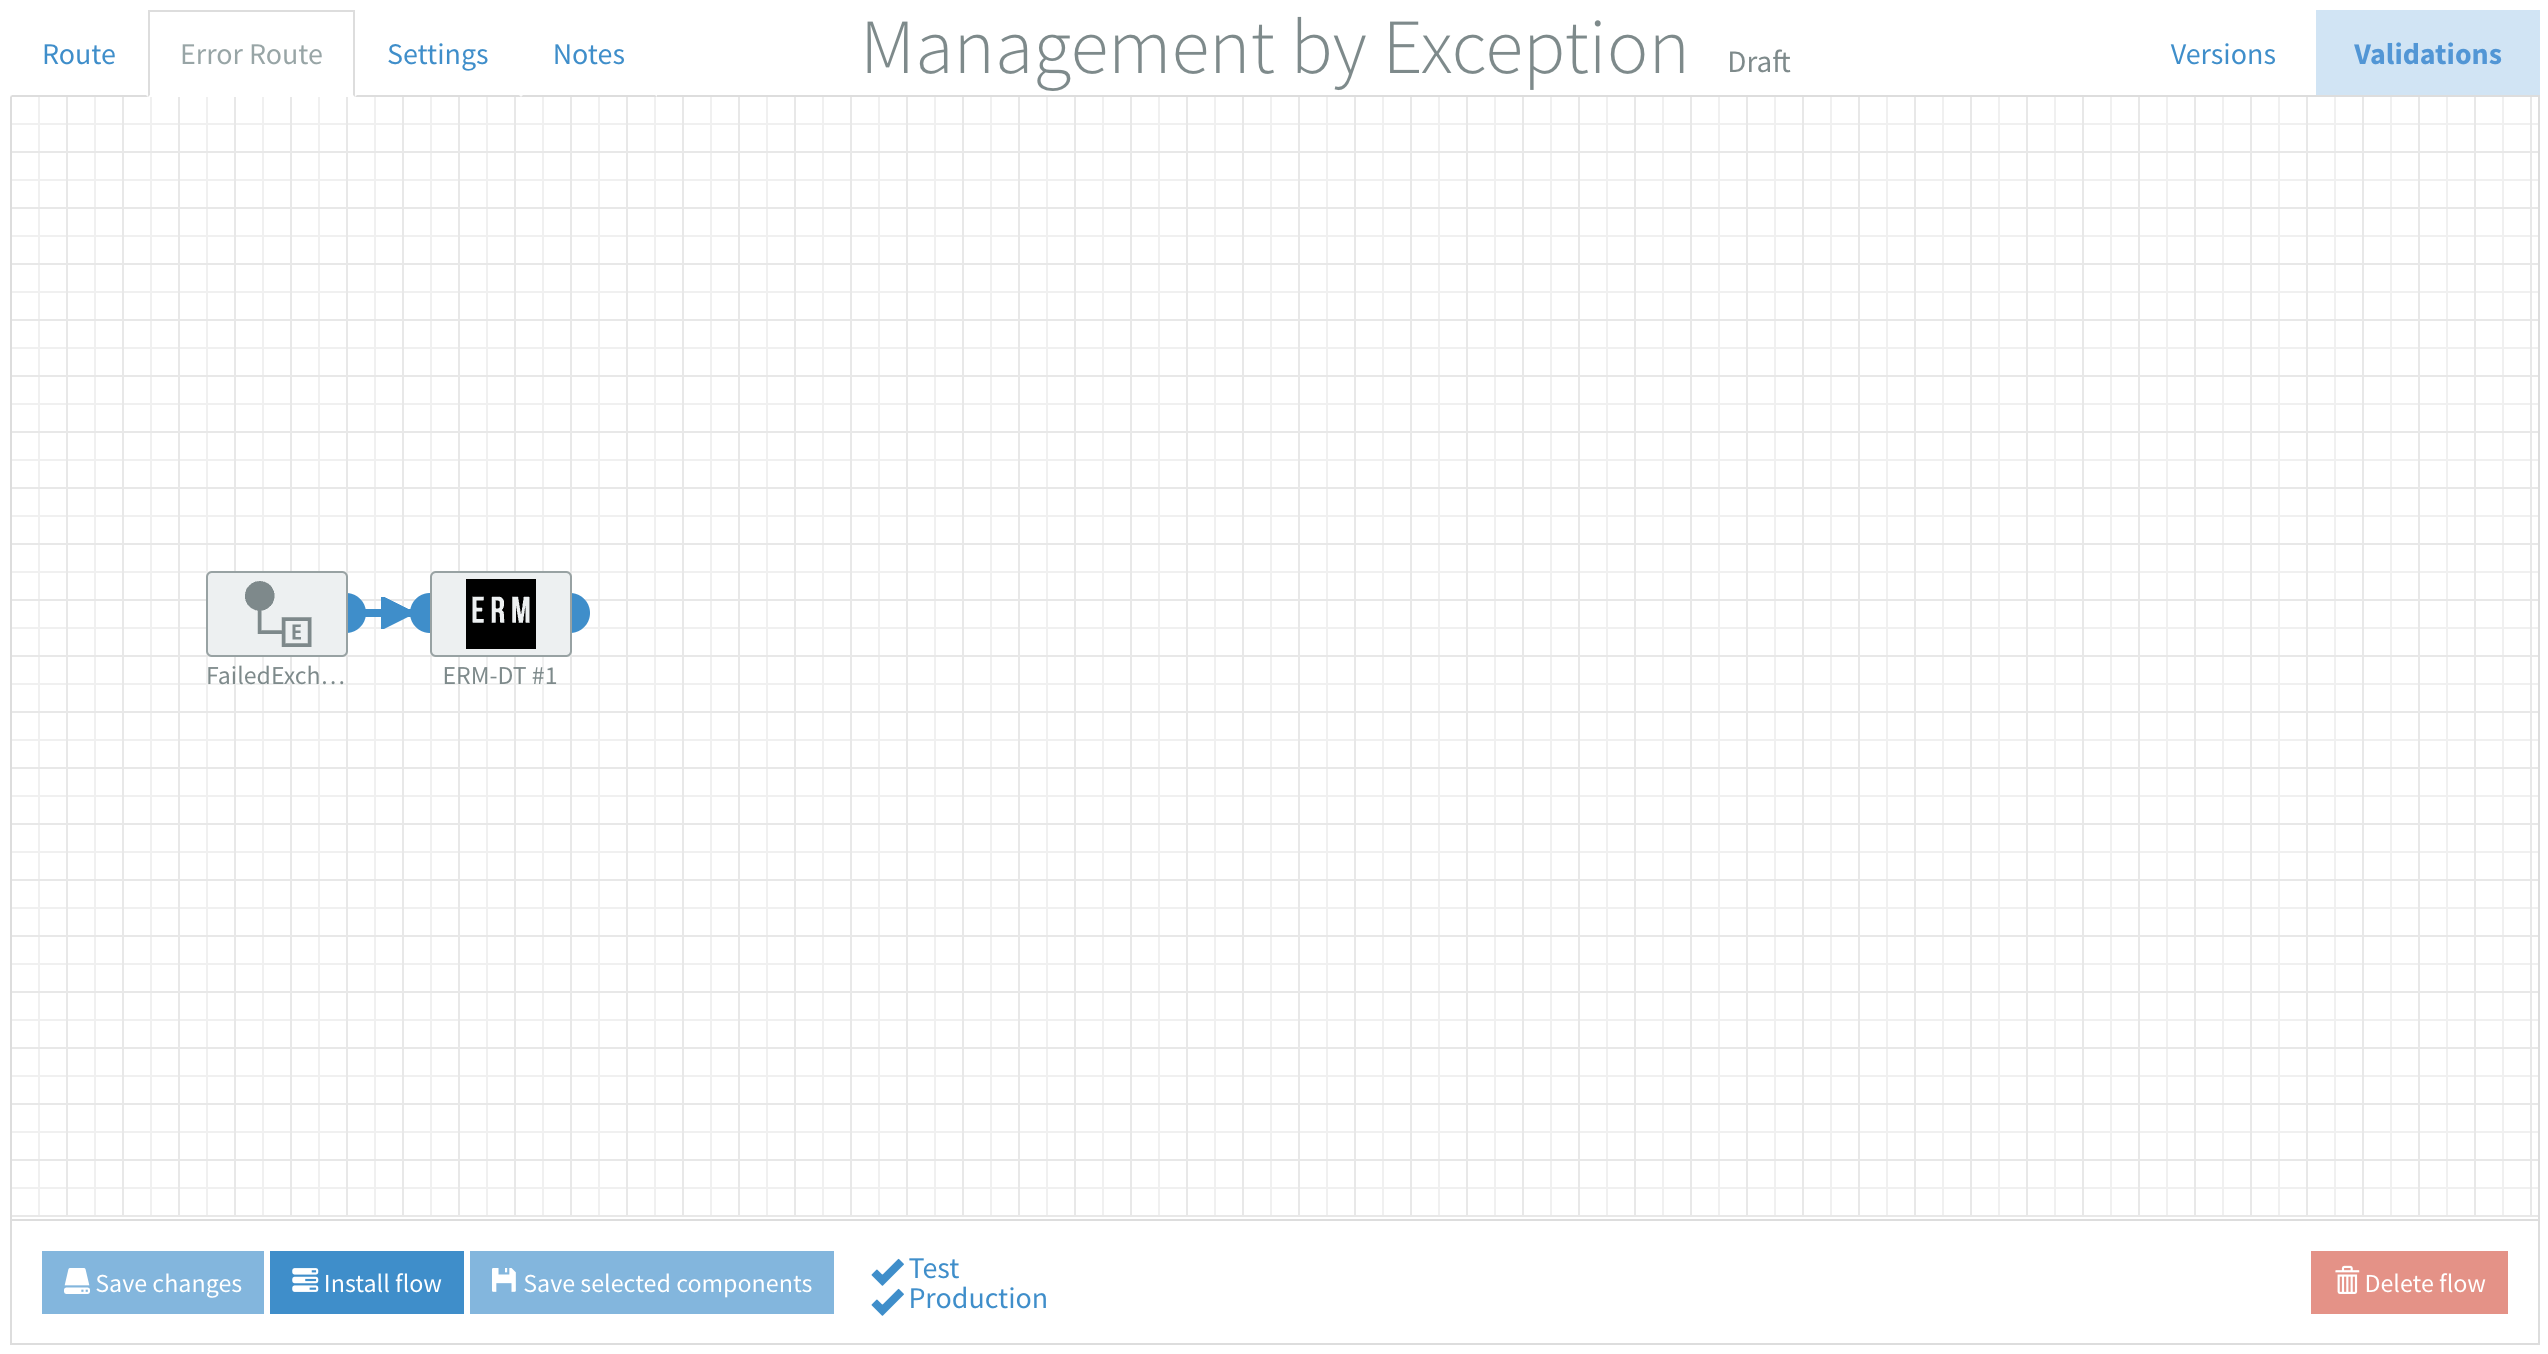
3. Error Route Monitoring (ERM)
The first step to start managing exceptions efficiently is to log exchanges that end up in the Error Route of your flows. You can think of the Error Route as a safety net that catches all failed exchanges. We have defined monitoring in the Error Route as Error Route Monitoring (ERM).
Every flow’s Error Route contains a FailedExchange component. Messages that end up at this component weren’t completed successfully in the Route. A message in the Error Route often contains valuable information about why it ended up there. In the Error Route you can build a flow that logs this data, for example in a SQL database.
Refer to our Using exceptions guide for a full reference on exceptions and the expressions to retrieve them from a failed exchange.
Using email
Be advised that the amount of data that flows through your integrations has the potential to create a lot of errors in a small amount of time. Therefore email should only be used when it concerns low frequency of data, in a test scenario or incidental errors. We recommend logging failed exchanges to a SQL database and create separate ‘reporting’ flows with the database as a source.
3.1 Why use Error Route Monitoring?
It’s good practice to monitor failed exchanges that go to the Error Route in a single data set. When the amount of active flows you manage increases it’s much more efficient to log them in one location. Our ERM component allows for multi-instance, multi-tenant and multi-environment logging in one database table. This one dataset acts as your starting point for reporting and analysis, instead of having to monitor individual flow logs & transactions.
3.2 ERM Component
Below you see a screenshot with the contents of our ERM component. It logs data from failed exchanges in the database, independent from the source of the exception. There can be HTTP, FTP, XPath, XSLT, type conversion errors and more.
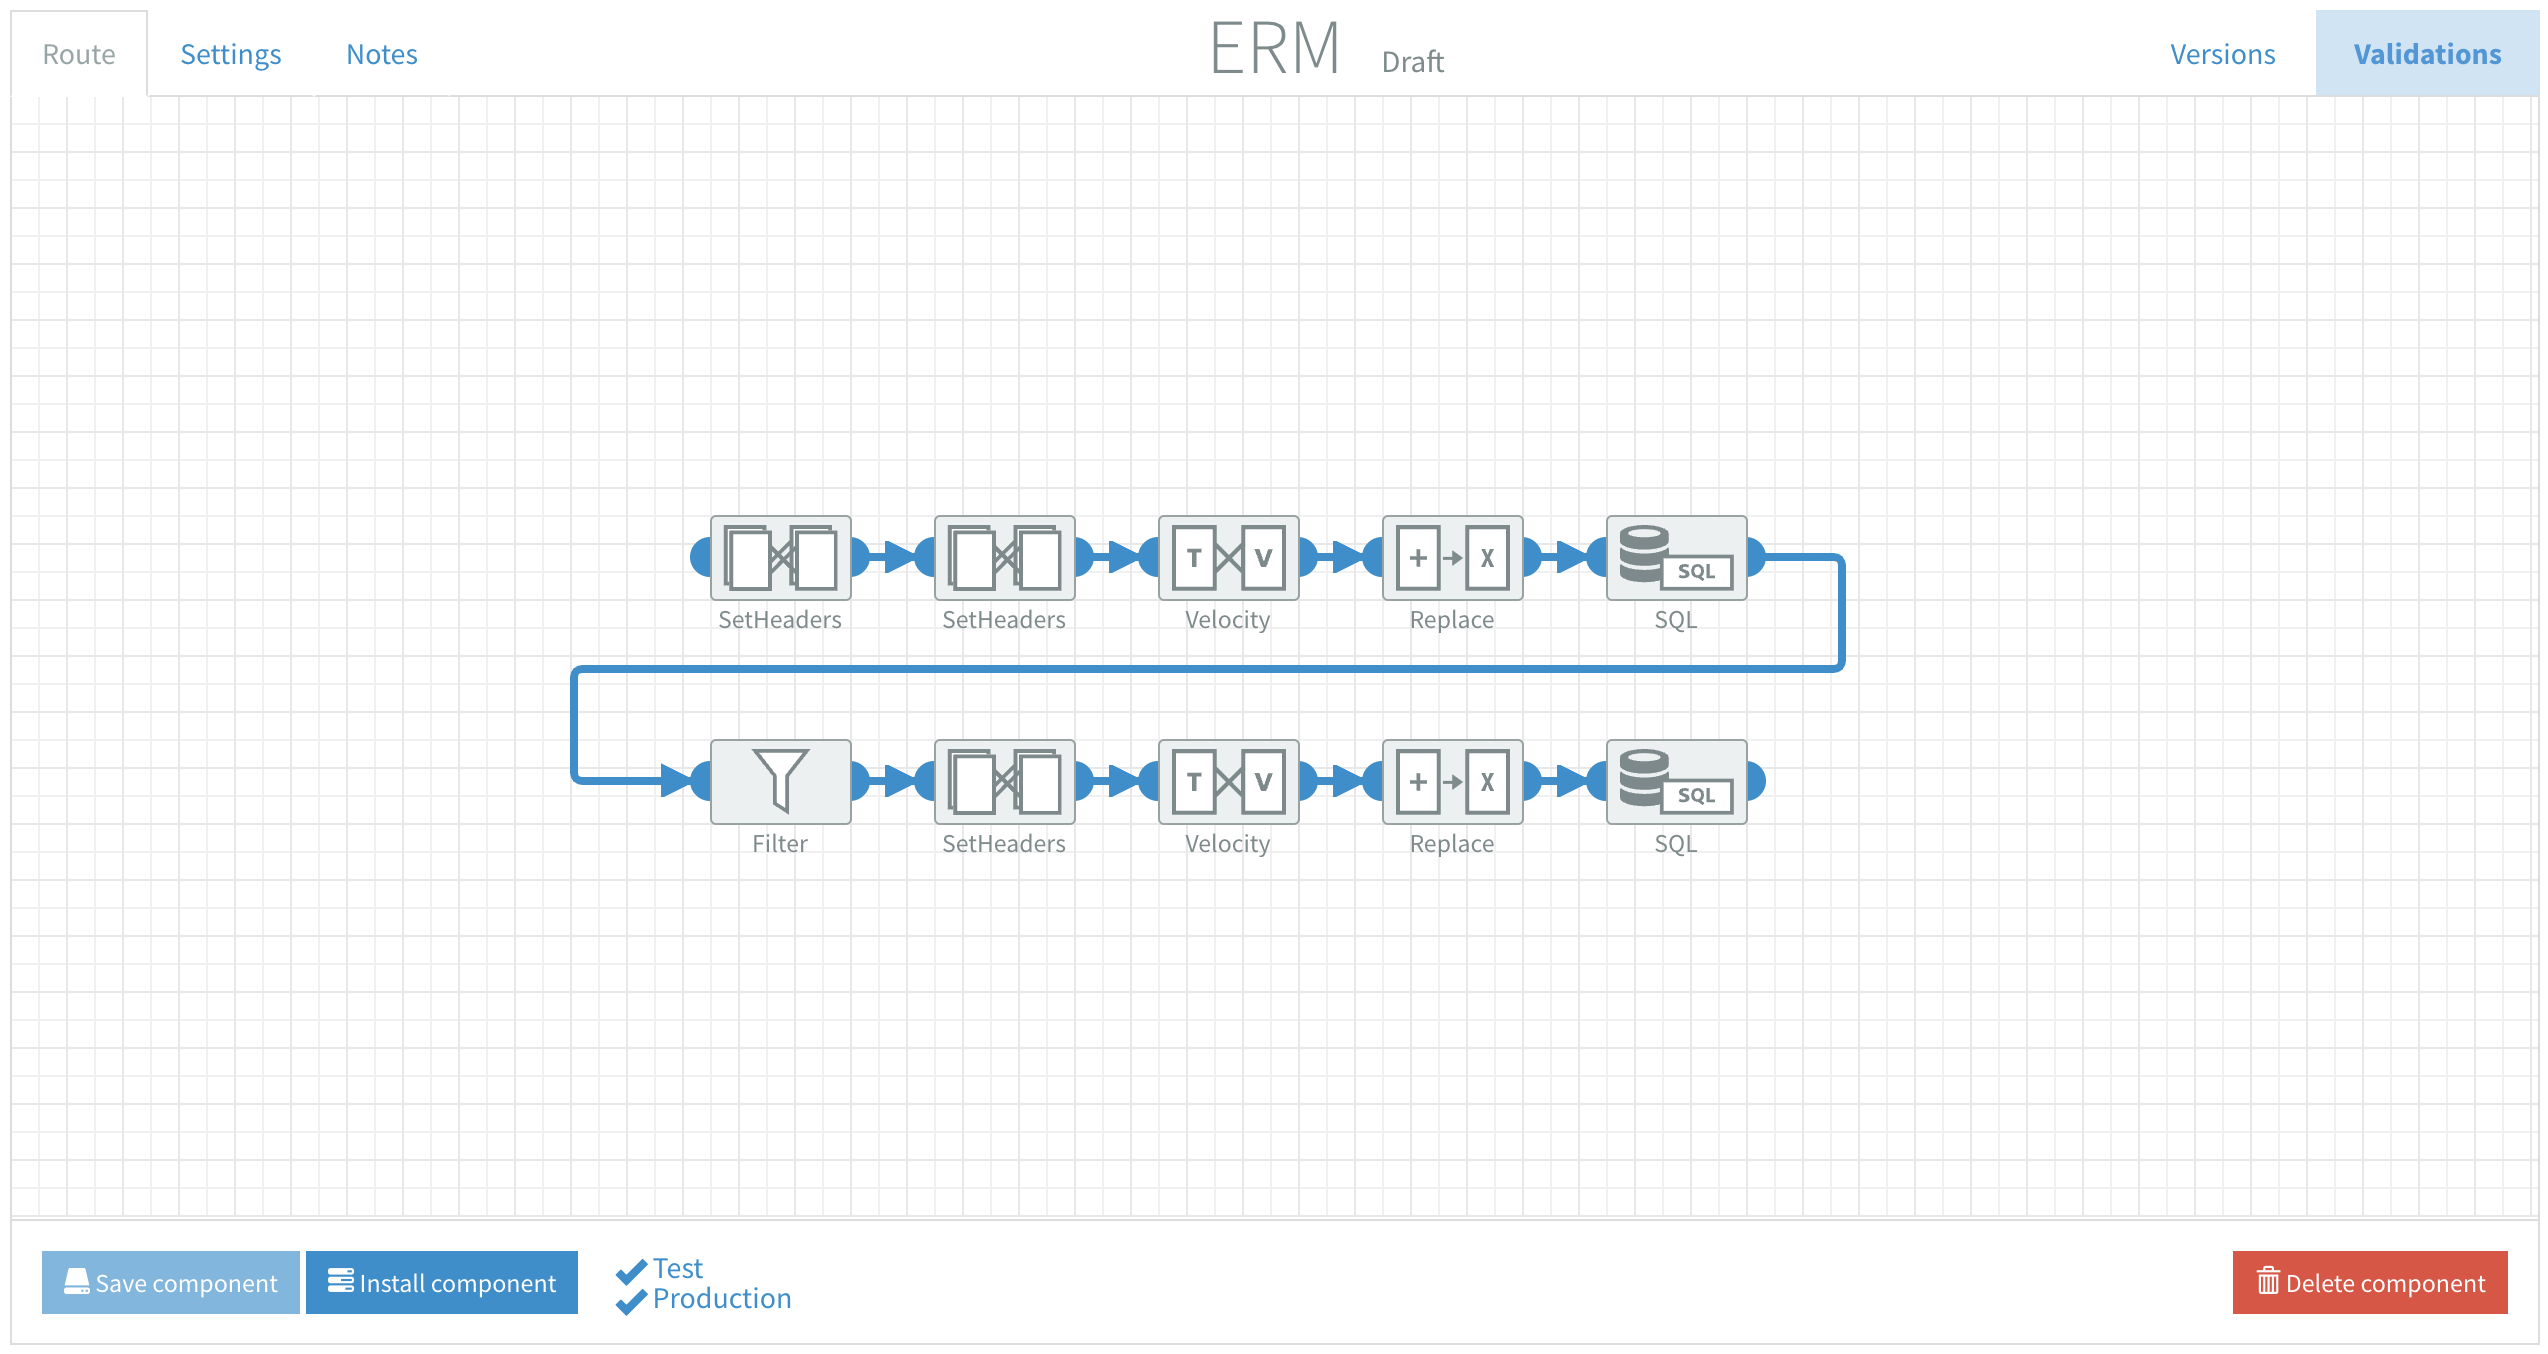
See 8.1 SQL Monitoring Table Structure for a full list and the definition of metrics stored.
3.2.1 Install & Implement ERM component
- Import ERM.json into your tenant
- Update the Flow settings with your database info / credentials (see image below)
- Optional: Add ERM User Definable Metrics in the Flow settings of the component
(if you edit the variables here they are going to be imported in every flow you add this component to) - Test the SQL connection in the Route by clicking the blue ‘Test Connection’ button
- Install the Component
- Navigate to the Error Route of the flow you want to add it to, in this case the Management by Exception example
- Drag & drop the ERM component from the Component library onto the canvas
- Connect to the FailedExchange component
- Optional: Update ERM User Definable Metrics in the Flow settings
(see specify User Definable Metrics per flow) - Install the Flow

Every flow that has this ERM component in it's Error Route will now log these failed exchanges to the database. You can use it to monitor multiple flows across multiple instances and/or tenants in one location.
3.3 ERM: Simulate errors
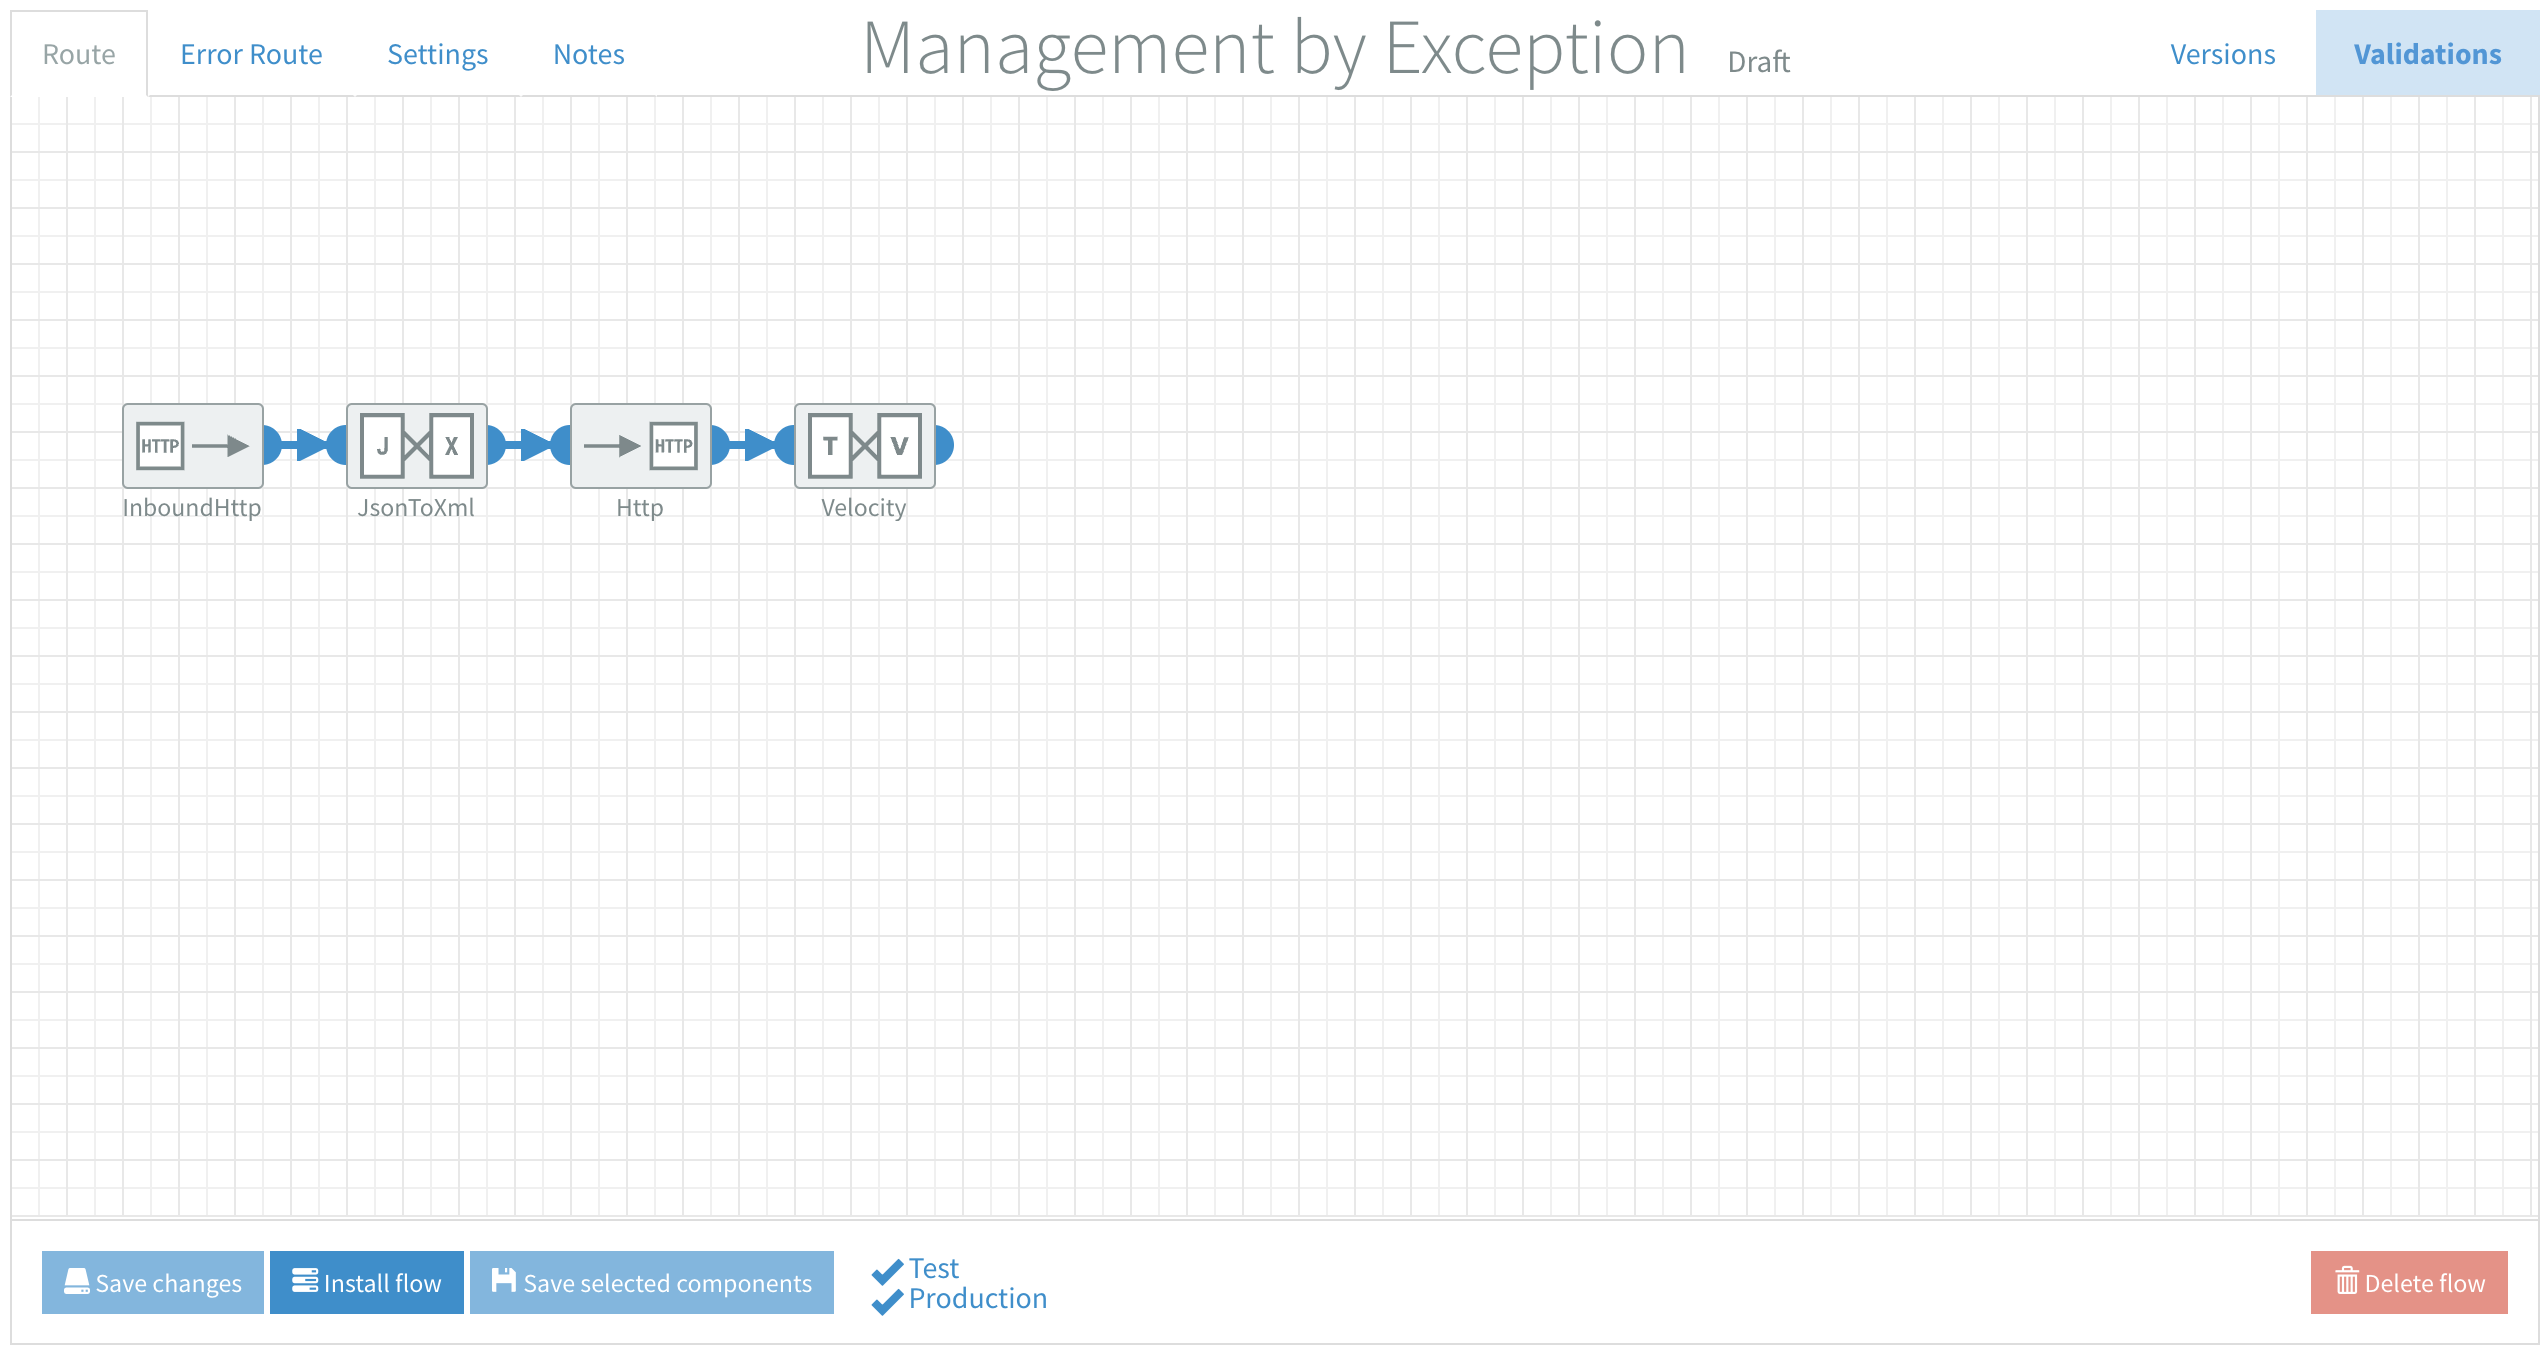
In the Route of the Management by Exception example there’s an Inbound HTTPS followed by a JSONtoXML and an Http component.
- Verify the Inbound HTTPS component has a valid Endpoint setting
- Verify the Http component setting ‘Use error route’ is set to ‘Yes’
After you have connected successfully with your database you can install the flow, in test or production. Now it is time for the interesting part; to force some non-HTTP and HTTP errors to see the results of ERM.
3.3.1 ERM: Non-HTTP error
Use Postman to send a body with an valid JSON to the Inbound HTTPS url of this flow, i.e.
{
Observe the created database entry with all the metrics collected to indicate when the exception occurred and where it originated from. Notice the provided information about the content / type of the exception.
error_message
The provided JSON could not be parsed to either a JSON object or a JSON array.
error_class
class org.json.JSONException
3.3.2 ERM: Another Non-HTTP error
Use Postman to send an empty body to the Inbound HTTPS url of this flow.
Observe the created database entry with all the metrics collected to indicate when the exception occurred and where it originated from. Notice the provided information about the content / type of the exception.
error_message
No body available of type: ... No type converter available to convert from type: null to the required type: ...
error_class
class org.apache.camel.InvalidPayloadException
3.3.3 ERM: HTTP error
Use Postman to send a body with an valid JSON to the Inbound HTTPS url of this flow, i.e.
{}
And a header with key:
url
And value:
https://start.exactonline.nl/api/v1/1234567/salesorder/SalesOrders
Observe the created database entry with all the metrics collected to indicate when the exception occurred and where it originated from. Notice the provided information about the content / type of the exception, including the exception body that often contains very specific information about the error.
error_message
HTTP operation failed invoking ... with statusCode: 401
error_body
<?xml version="1.0" encoding="utf-8" standalone="yes"?>
<error xmlns="http://schemas.microsoft.com/ado/2007/08/dataservices/metadata">
  <code></code>
  <message xml:lang="">Unauthorized - Authentication required</message>
</error>
error_class
class org.apache.camel.http.common.HttpOperationFailedException
4. Define the expected response
It’s tempting to let your flow continue with integration steps after an HTTP call, assuming the response will always be fine. We see flows as shown in the image below a lot, with an Http component with ‘Use error route’ option set to ‘Yes’. The Velocity component in the image represents the continuation of an integration.
4.1 Why define the expected response?
You happily assume nothing will go amiss after the Http component and continue with your integration. While actually, you have no clue if or how the endpoint is responding. This will eventually lead to all sorts of errors down the line and you will have to consult the Flow Manager logs and transactions to see what went wrong.
This is not a question of if, but when. That’s why you define the expected response.
As mentioned before, verifying the validity of the content of the response is outside of the scope of this guide. We will focus on defining successful communication with an endpoint.
4.2 Managing responses
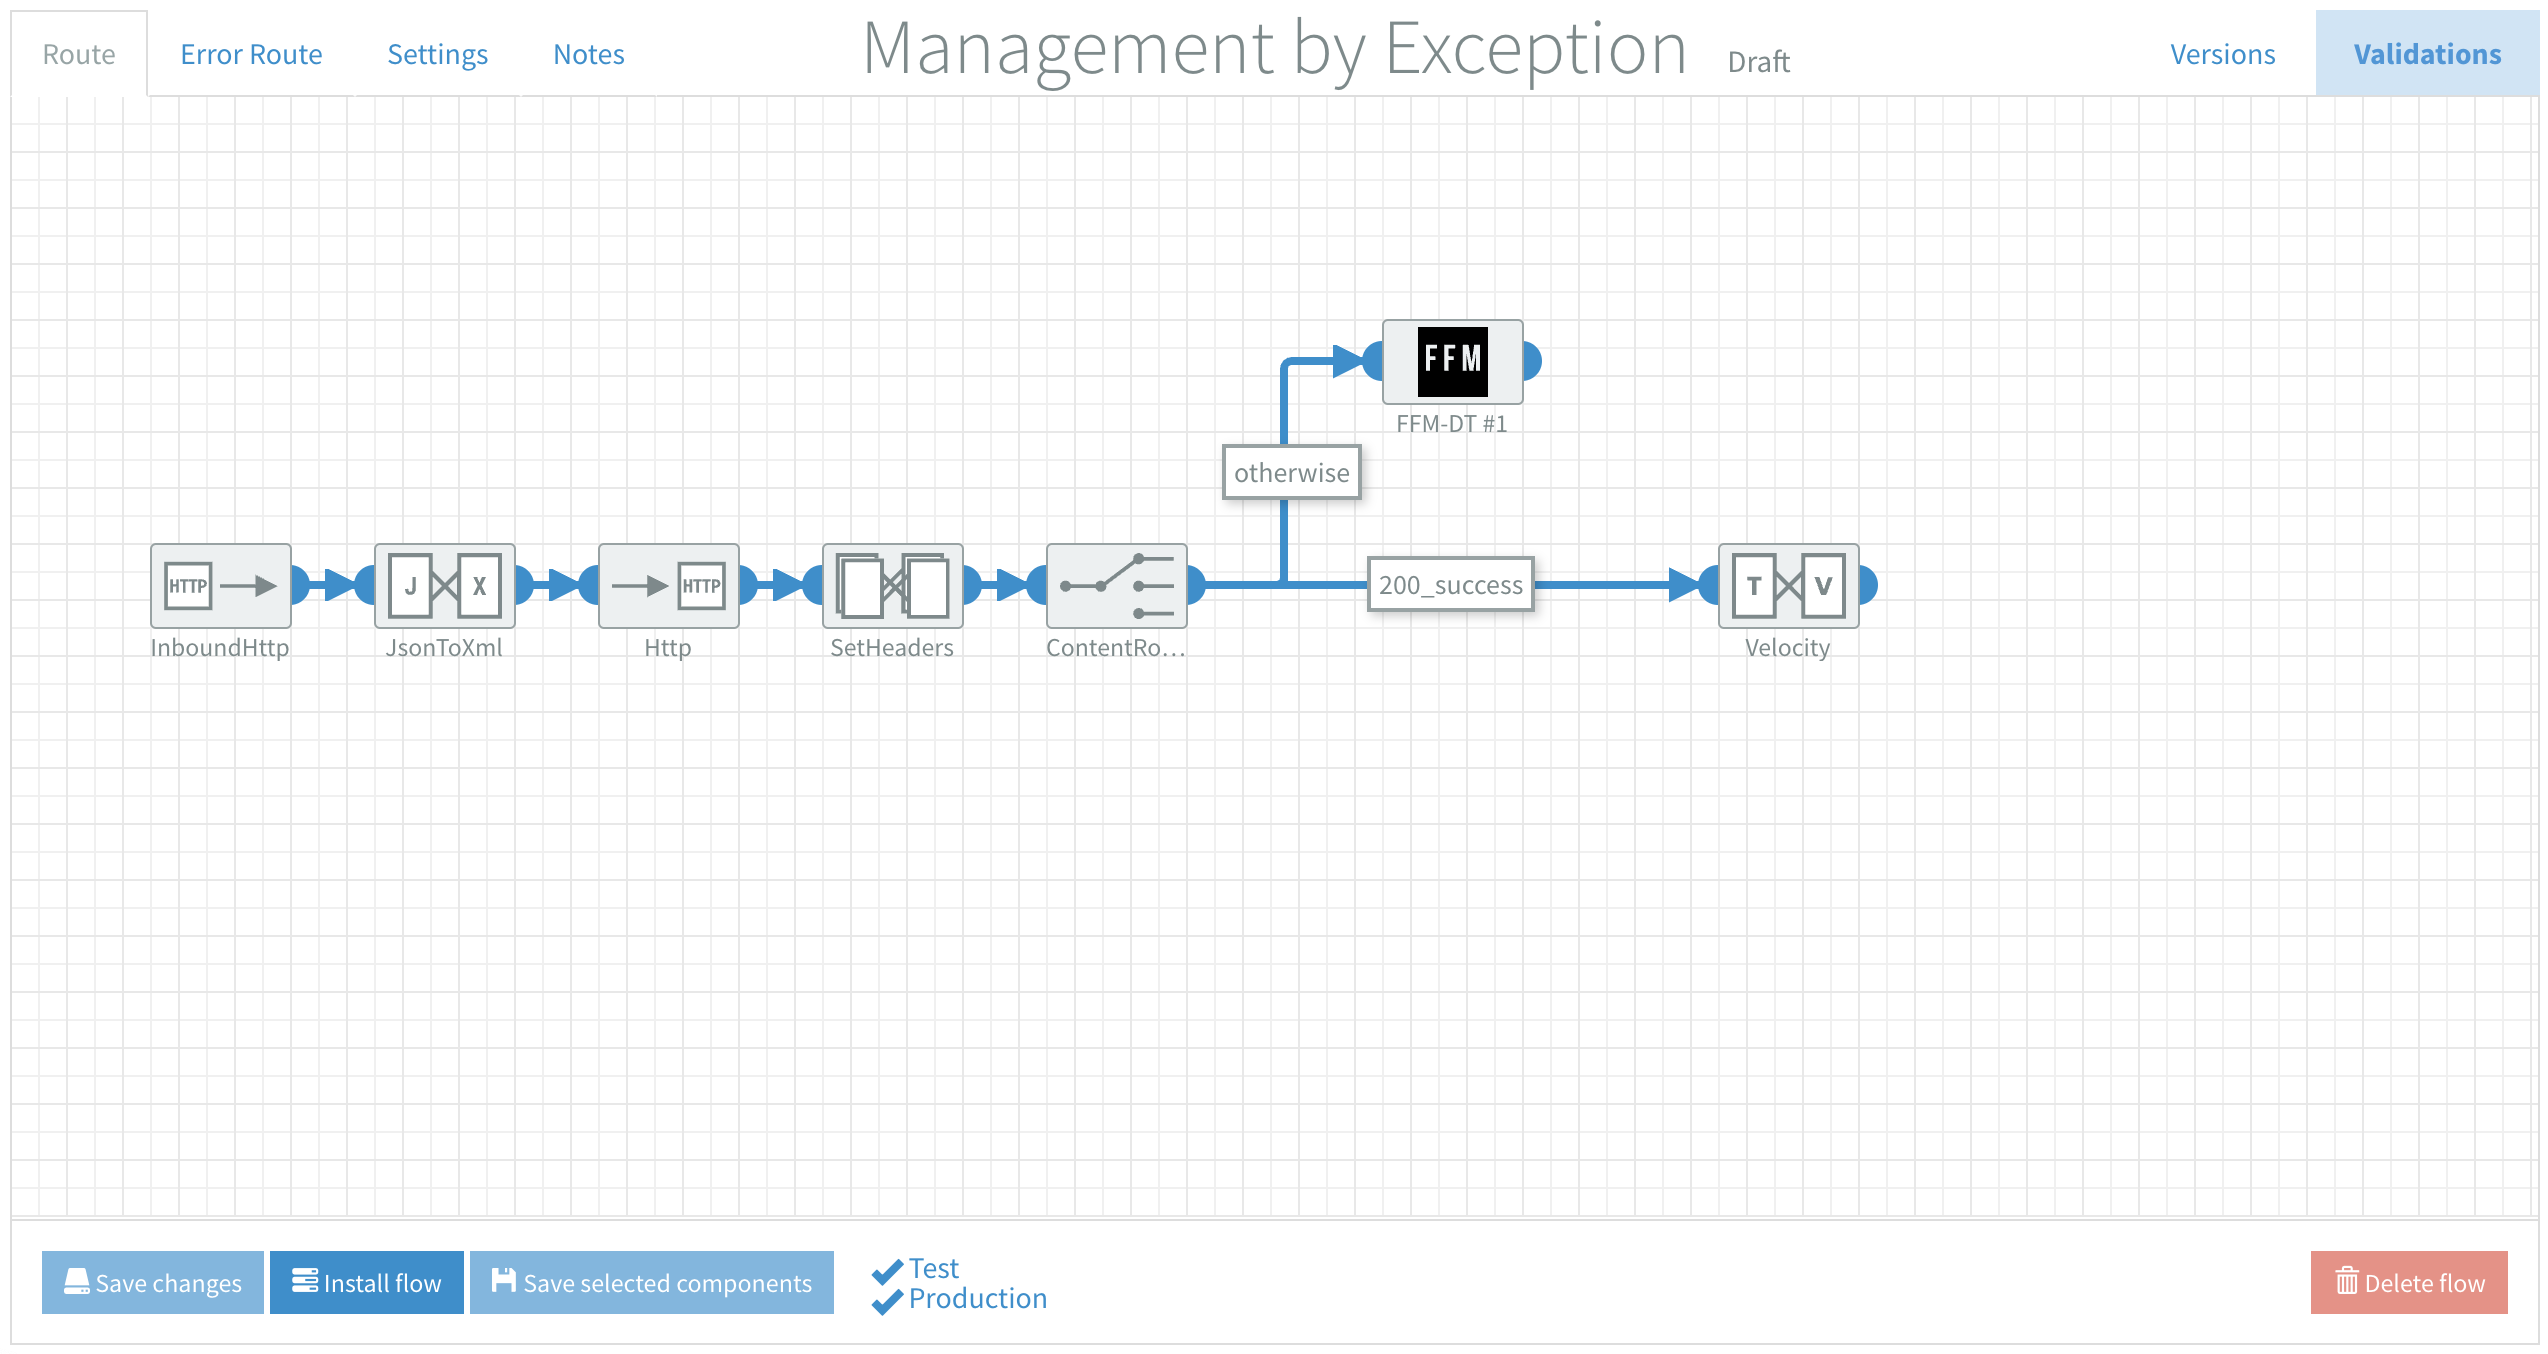
Thes Content Router is the ideal tool to manage HTTP responses. It’s important to set the ‘Use error route’ option in the Http component to ‘No’ for this to work. Imagine the use case in the example we’ve provided expects a correct HTTP call to have a response code 200.
Add a Content Router with a rule called 200_success defined with the following Simple Expression syntax: ${header.CamelHttpResponseCode} == '200'
All responses that adhere to this rule will continue along this route and all other responses will be routed out the otherwise rule so they do not cause issues further down the line anymore. See the image below.
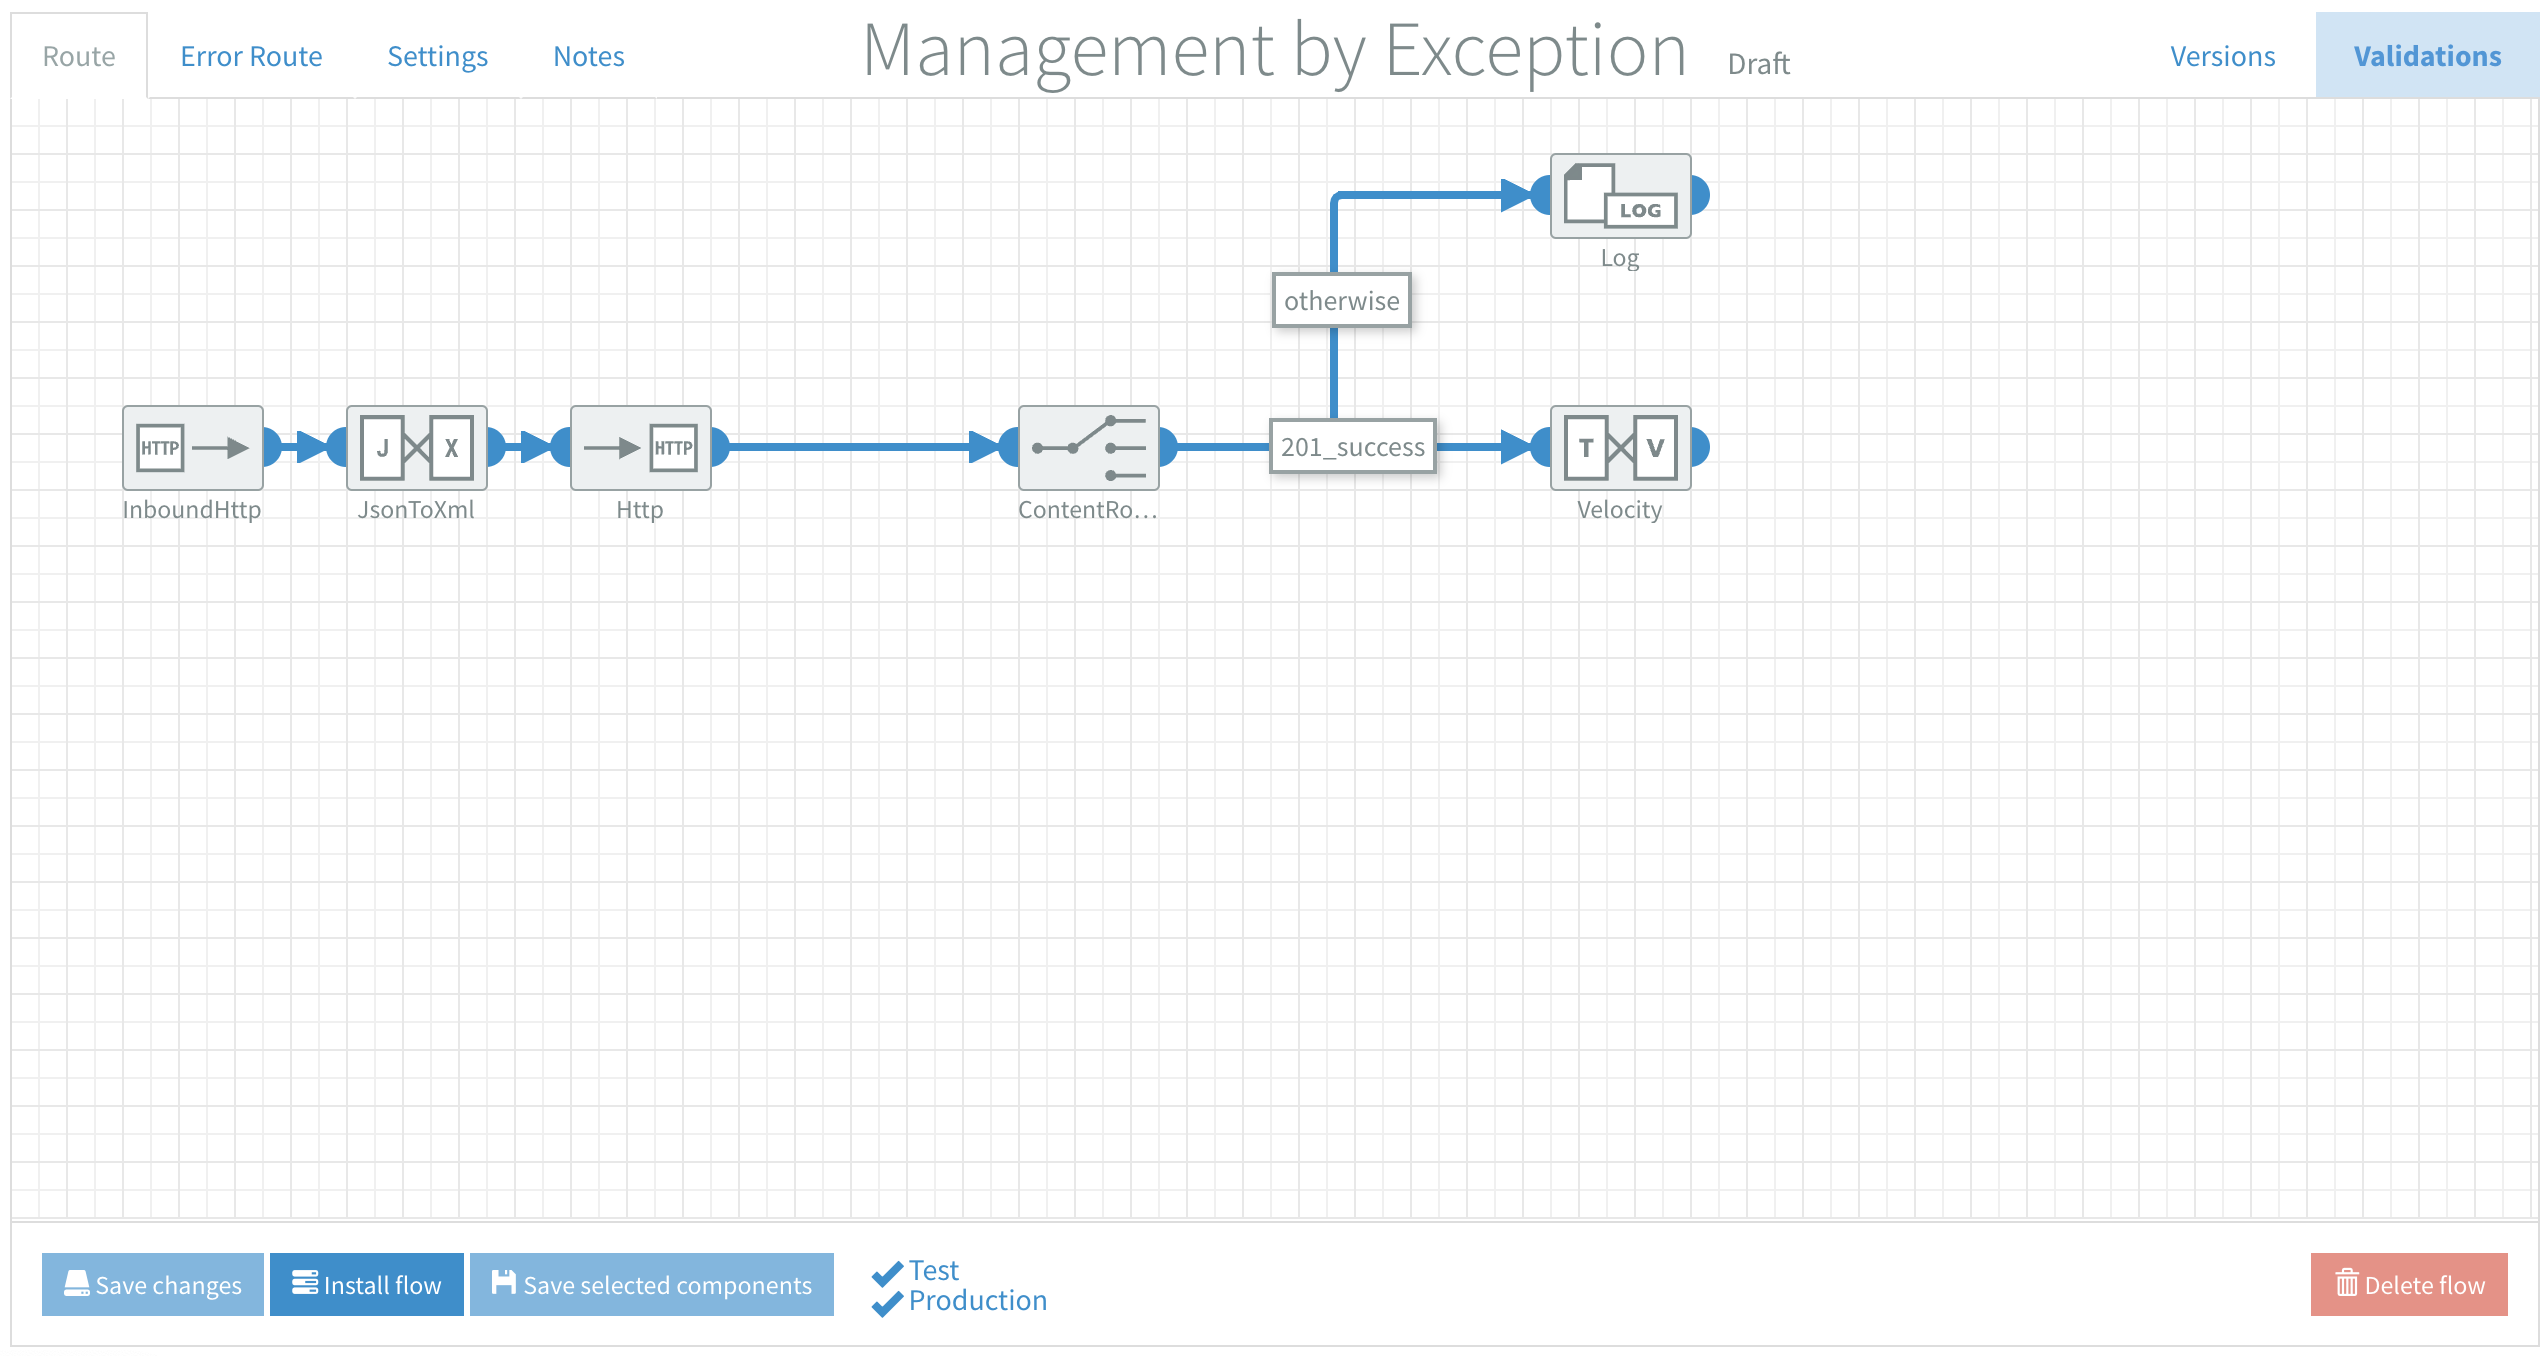
You will have to define the expected response in the Content Router with an applicable rule expression for your endpoint.
- An HTTP response header
200or201with a simple expression - A response body with an empty XML
<error></error>element with XPath - A response body with a JSON key & value
{"Success" : true}with JsonPath - Any other means your endpoint communicates status, refer to the documentation
The otherwise rule in this example only logs to the Flow Manager. The last step for monitoring is to store the relevant metrics of an exception occurring in the Route of a flow into the database. This is the start of Flow Function Monitoring (FFM).
5. Flow Function Monitoring (FFM)
The next step is to store all the responses in the Route that are not expected in one location. Because the dataset is very similar to ERM we are using the same database table.
5.1 Why use Flow Function Monitoring?
Just like with ERM it’s good practice to monitor exceptions in your integration in a single data set. FFM also allows for multi-instance, multi-tenant and multi-environment logging in one database table. This one dataset acts as your starting point for reporting, analysis and error handling, instead of having to monitor individual flow logs & transactions.
5.2 FFM Component
The FFM flow follows the same steps as ERM in general. Again, it’s important to set the ‘Use error route’ option in the Http component to ‘No’. Above you can see otherwise is now used to store data from exceptions in the Route. In this example everything except responses with a 200 HTTP code.
Below you see a screenshot with the contents of our FFM component.
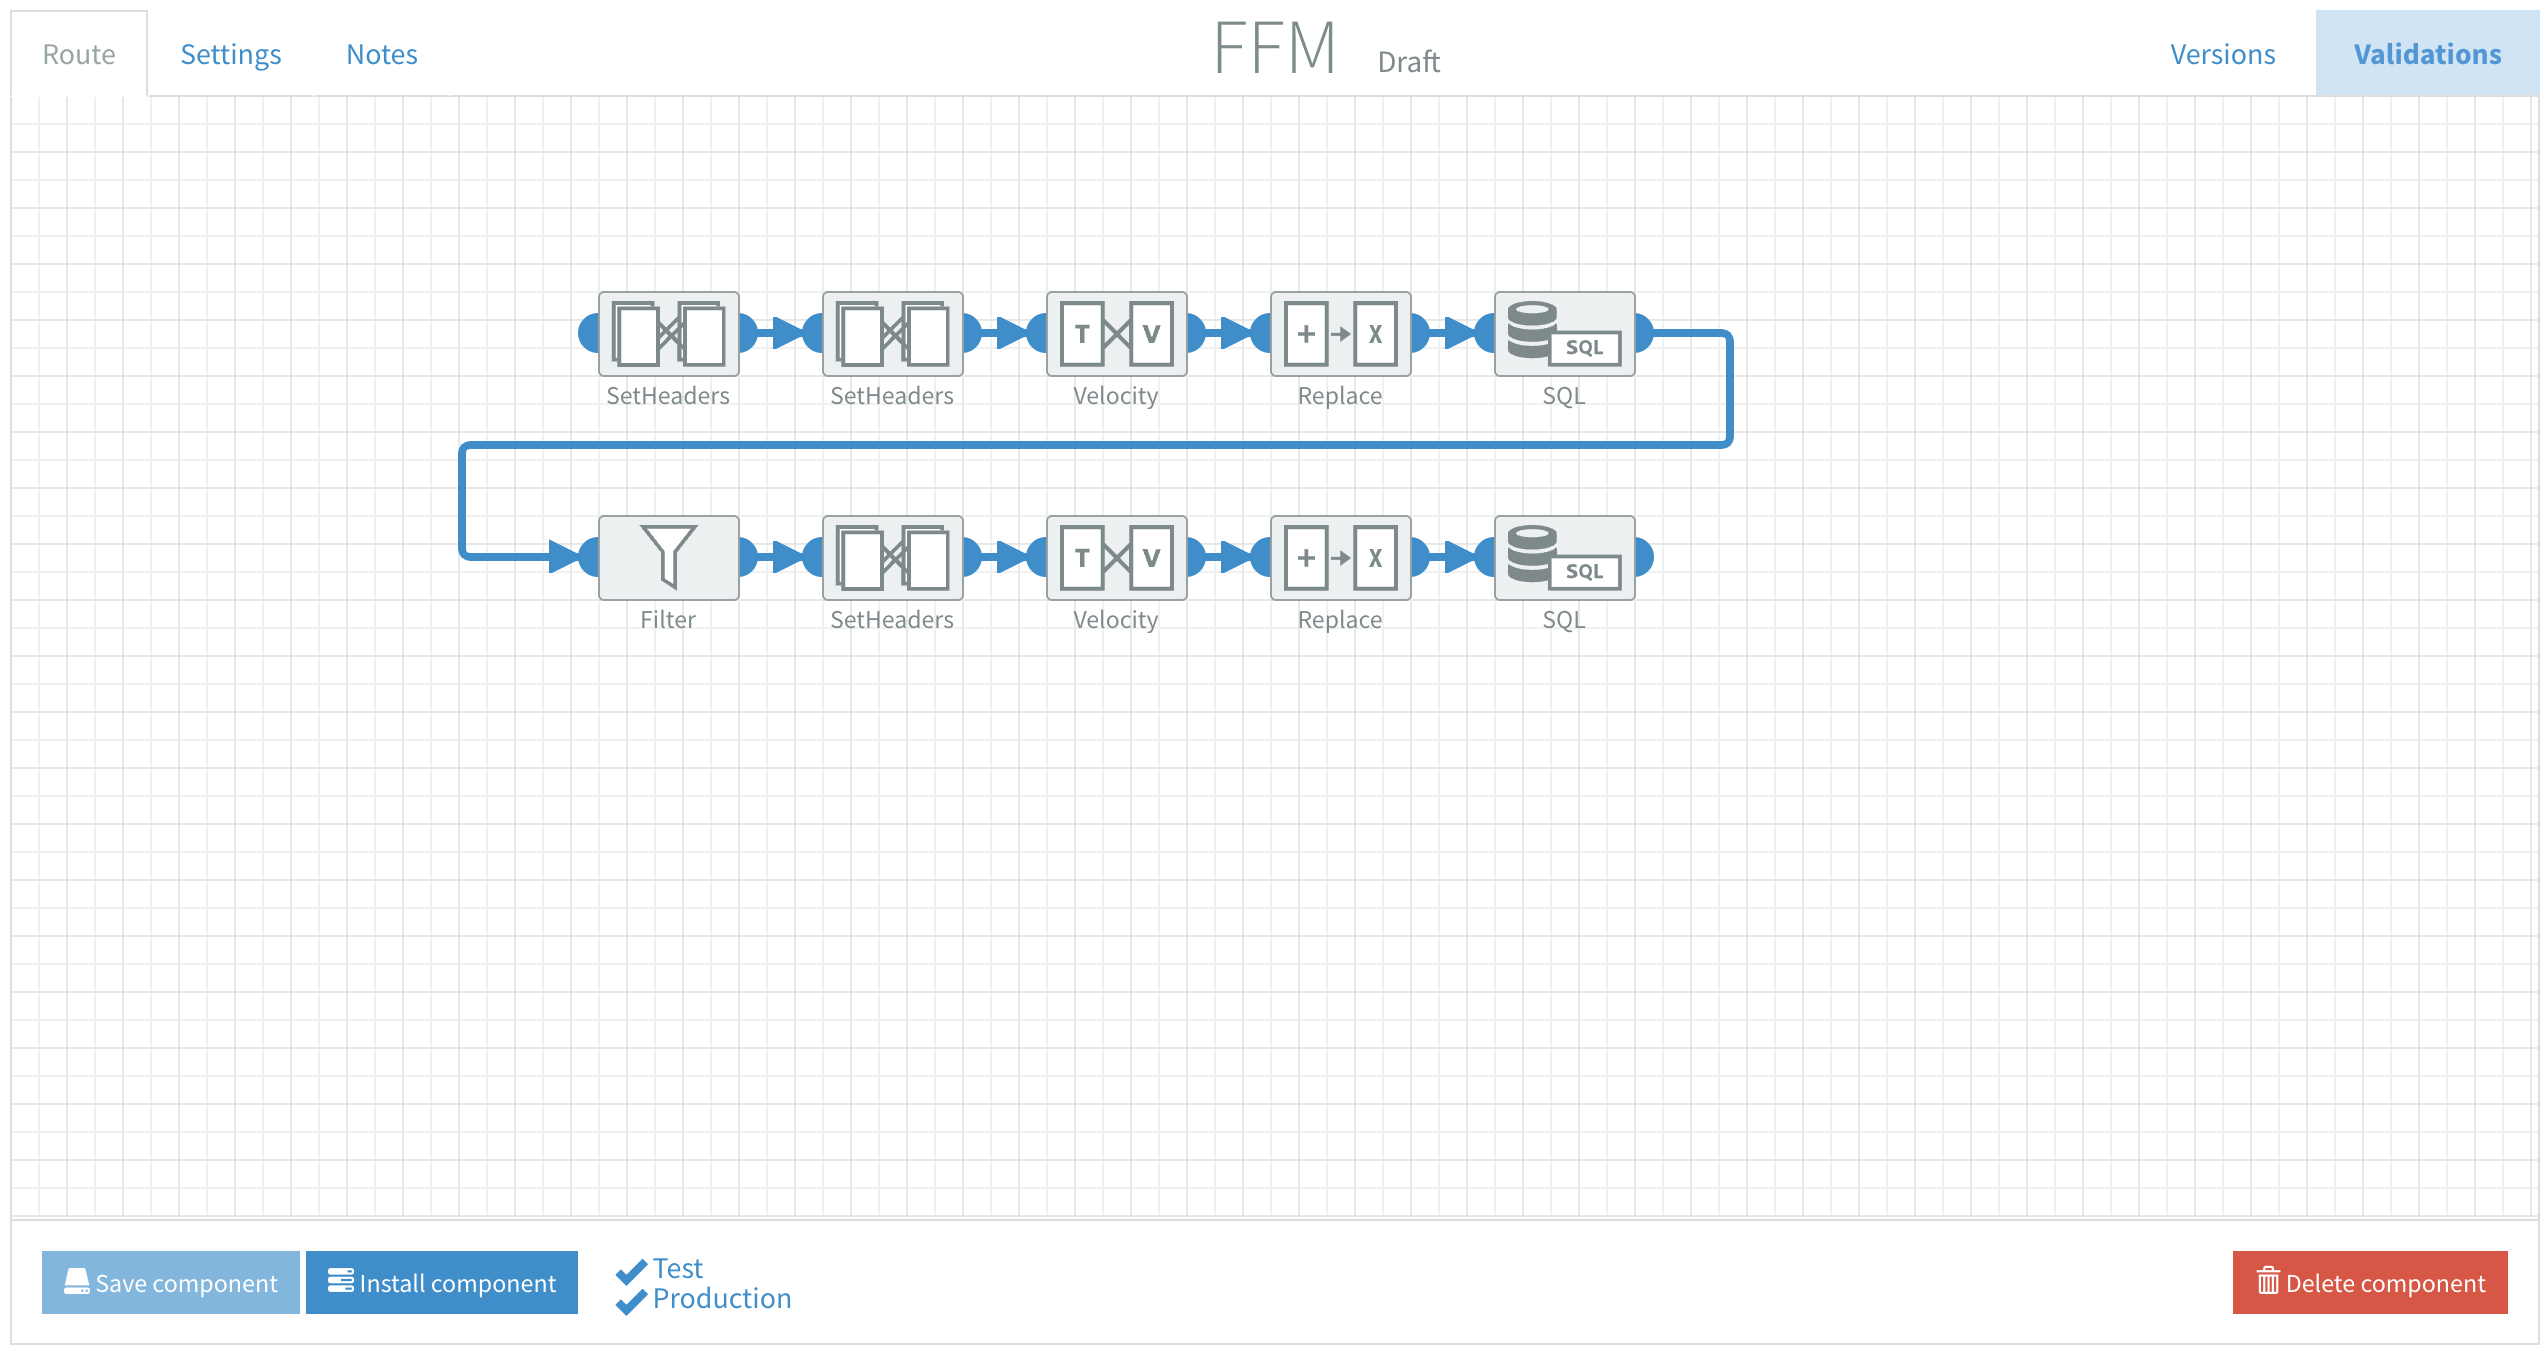
See 8.1 SQL Monitoring Table Structure for a full list and the definition of metrics stored.
5.2.1 Install & Implement FFM component
- Import FFM.json into your tenant
- Update the Flow settings with your database info / credentials (see image below)
- Optional: Add FFM User Definable Metrics in the Flow settings of the component
(if you edit the variables here they are going to be imported in every flow you add this component to) - Test the SQL connection in the Route by clicking the blue ‘Test Connection’ button
- Install the Component
- Navigate to the Management by Exception example
- Drag & drop the FFM component from the Component library onto the canvas
- Connect to the Otherwise rule of the Content Router
- Optional: add a SetHeaders component after the Http component if it's important to log its response time, with:
- Header Name:
Set_ComponentResponseTime - Simple expression:
${header.ComponentResponseTime}
- Header Name:
- Optional: Update FFM User Definable Metrics in the Flow settings
(see specify User Definable Metrics per flow) - Install the Flow
Every flow that uses this technique will now log functional exceptions to the database. You can use it to monitor multiple flows across multiple instances and/or tenants in one location. Specific errors that keep occuring can be subject for implementation of error handling, see 6. Error Handling.
5.3 FFM: Simulate errors
In the Route of the example there’s an Inbound HTTPS followed by a JSONtoXML and an Http component.
- Verify the Inbound HTTPS component has a valid Endpoint setting
- Verify the Http component setting ‘Use error route’ is set to ‘No’.
After this setup you can install the flow, in test or production. Now it is time for the interesting part; to force an HTTP error to see the results of FFM.
5.3.1 FFM: HTTP error
Use Postman to send a body with an valid JSON to the Inbound HTTPS url of this flow, i.e. {}
And a header with key:
url
And value:
https://start.exactonline.nl/api/v1/1234567/salesorder/SalesOrders
Observe the created database entry with all the metrics collected to indicate when the exception occurred and where it originated from. Notice the provided information about the content / type of the exception, including the exception body that often contains very specific information about the error.
Important!
Notice the minor differences between the information originating from ERM (failed exchange -> exceptions) and FFM (no failed exchange -> no exception in error_class).
error_message
https://start.exactonline.nl/api/v1/1234567/salesorder/SalesOrders with statusCode: 401
error_body
<?xml version="1.0" encoding="utf-8" standalone="yes"?>
<error xmlns="http://schemas.microsoft.com/ado/2007/08/dataservices/metadata">
  <code></code>
  <message xml:lang="">Unauthorized - Authentication required</message>
</error>
error_class
401: Unauthorized
Remark
Depending on your endpoint’s response some custom header might have to be used to log the most informative data. Feel free to use the User Definable Metrics for this. See Types of Error Responses for examples.
6. Error Handling
Now you’ve set up the expected response and your flow has a way to monitor any exceptions on your ‘happy flow’. It’s time to add rules to the Content Router that will handle returning errors that we’ve logged, eliminating the need for user intervention.
6.1 Error handling using HTTP response codes
Imagine your logs show a couple of 409 and 429 HTTP responses. In the example below you can see two added rules: 409_already_exists and 429_too_many_requests.
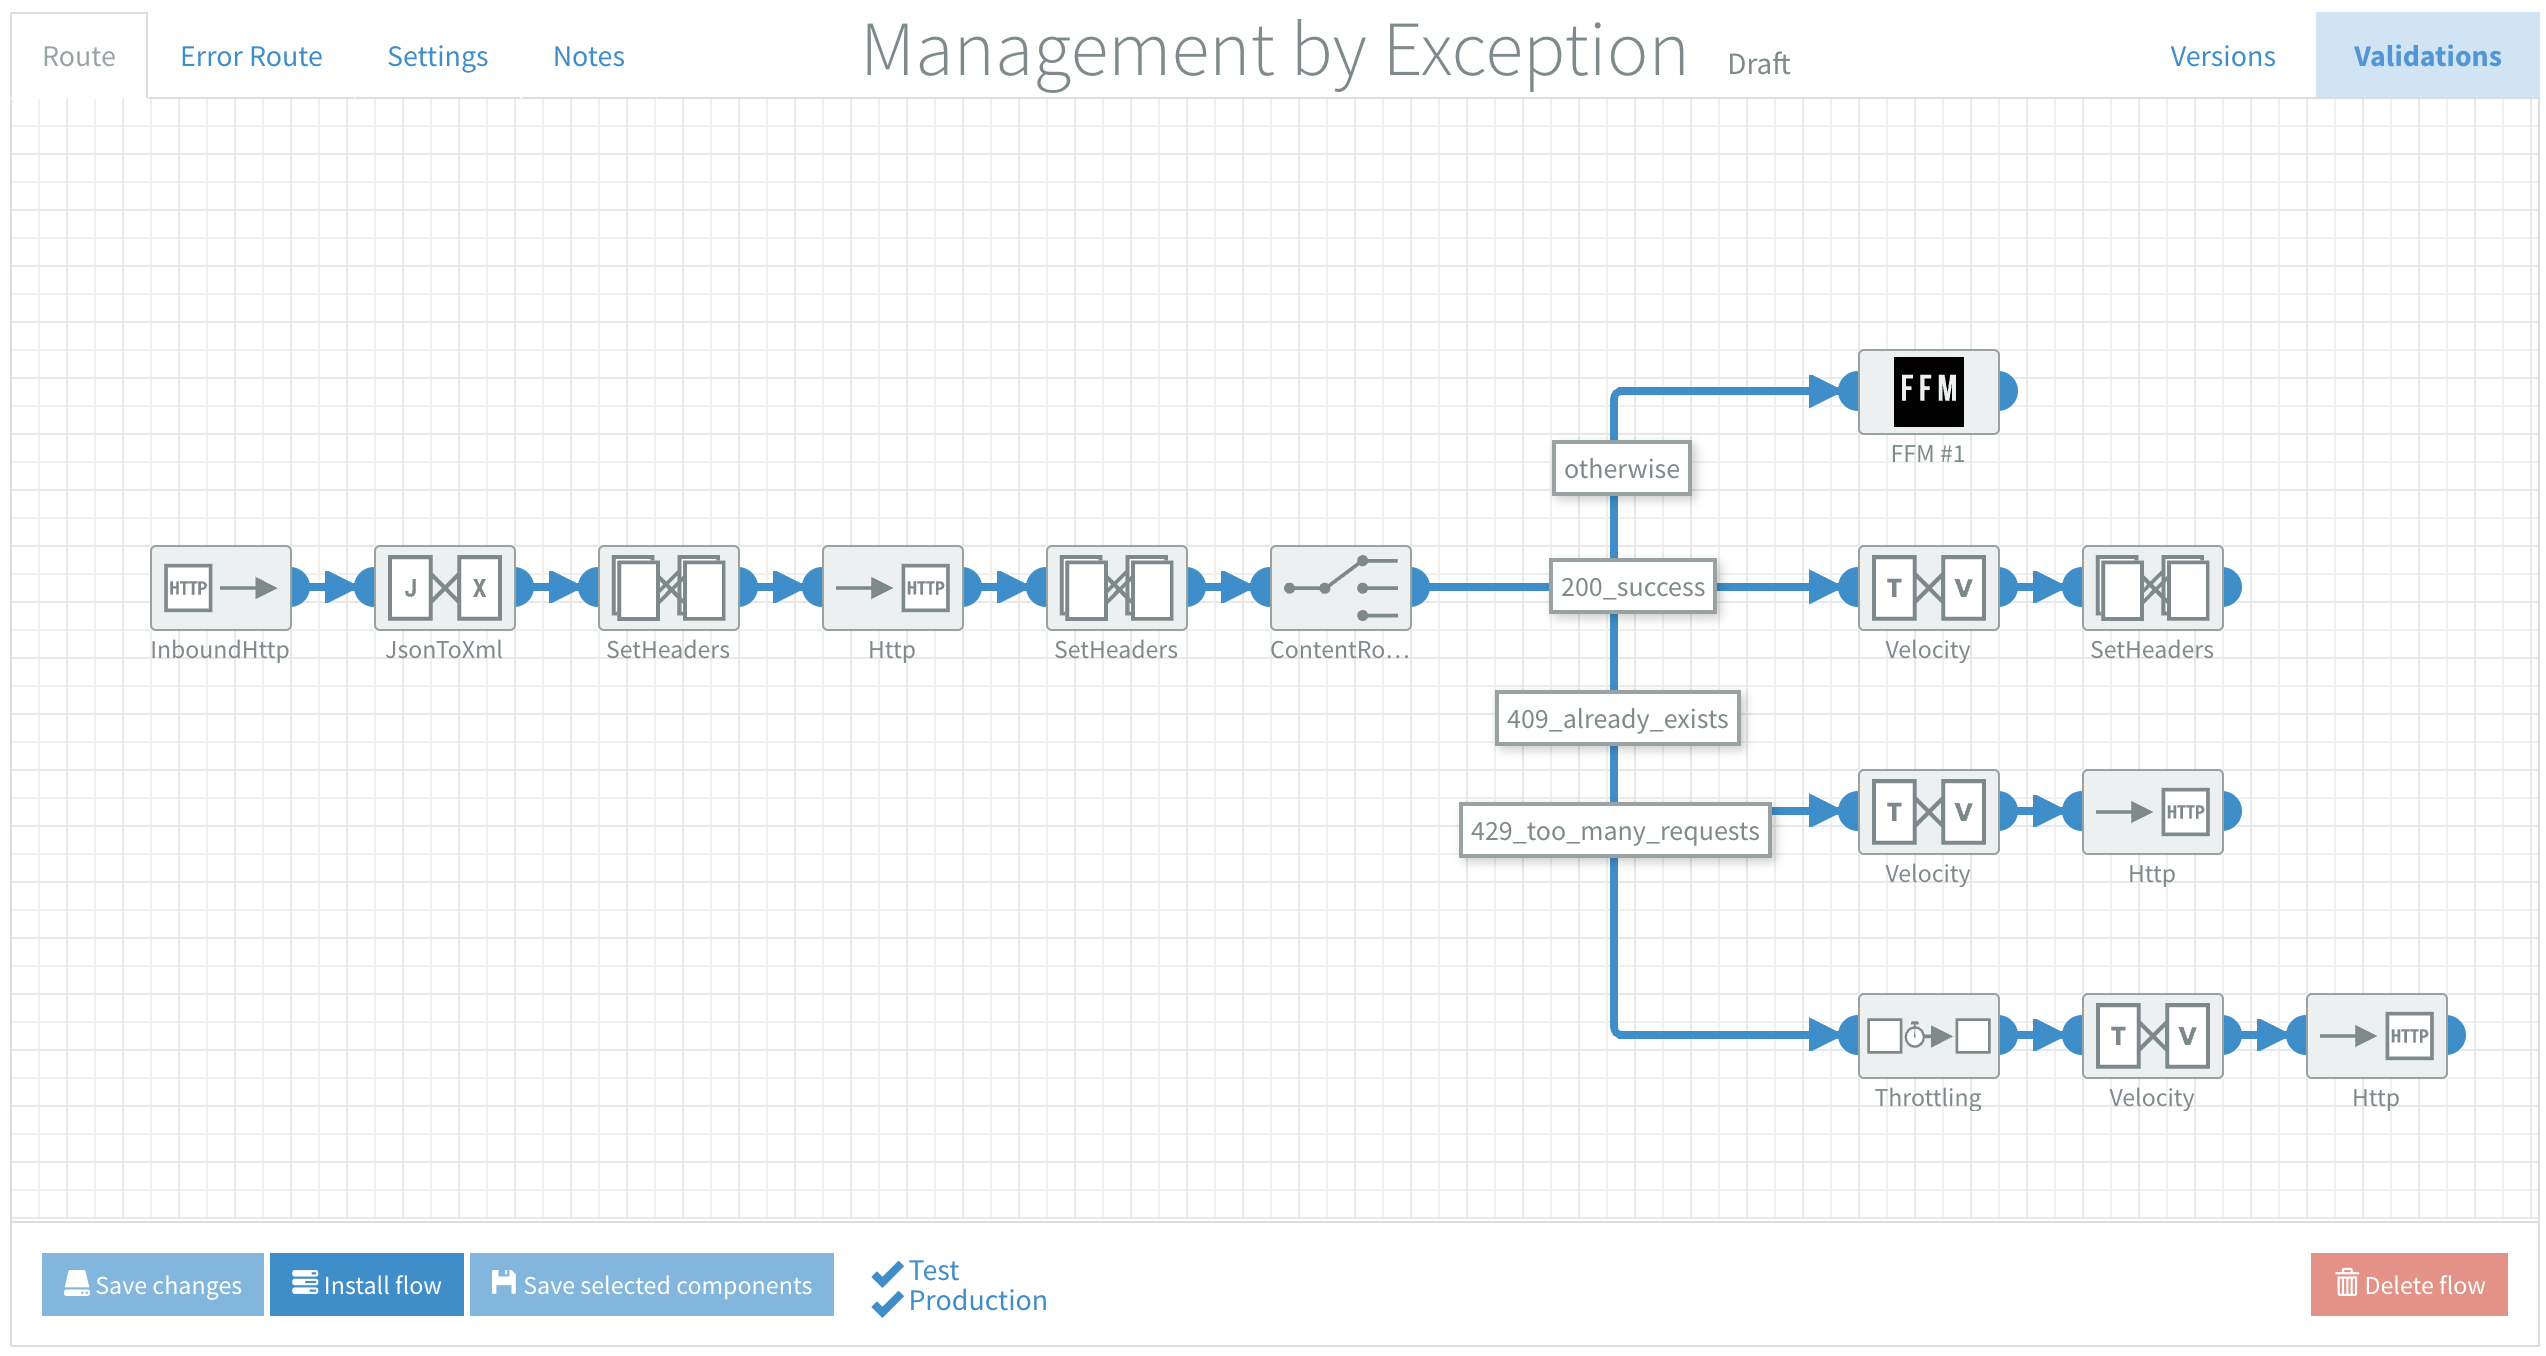
You’ve tested it and the solution for the 409 response is to use PUT (update) instead of POST (create) in your request. You can add the rule with the following Simple Expression:
${header.CamelHttpResponseCode} == '409'
Now you can add the components to handle this error:
- To enable the integration to use the body as it was just before the initial HTTP call we set the body on a header with a Simple
${bodyAs(String)}expression before the first Http call - The first step of handling this error is to put the body back into the Velocity component after the Content Router
- Then add another Http component that you set to PUT so the data is updated on your endpoint instead of failing to create a duplicate with POST
The setup for the 429 response is very similar to the 409 response. You use the same syntax in the Content Router, just with 429 instead of 409 in the Simple Expression. The handling of this error is a little bit different. Because the server was limiting additional requests we now wait some time (Throttle component) and then try again.
Of course you can add monitoring after your calls in the error handling to see if they were processed correctly.
6.2 Error handling using the response body
Sometimes an endpoint doesn’t use specific HTTP codes to inform you about errors with your request. The server might send a HTTP 200 code and you interpret this as your request being processed successfully. But then when you look at the endpoint nothing happened.
In the tracing of the flow you notice that the server responded with a JSON in the body that says something about a specific error. The syntax for the Content Router to check for a 200 HTTP code and the body containing this [Specific Error] is as follows:
${header.CamelHttpResponseCode} == '200' && ${bodyAs(String)} contains '[Specific Error]'
Now you are able to handle this specific error just like in the examples before.
7. Final thoughts
Every endpoint has its own method of communicating errors, they often don’t comply with standards. Responses might not even be consistent within one endpoint; i.e. some errors are in the response body, while others are communicated in response headers. See 8.2.2 Types of Error responses.
Best practice is to refer to your endpoint’s documentation. But, because they don’t always communicate (all) possible responses, test it during the development of your integration as well. Try to ‘break’ an endpoint and evaluate how it responds.
For example try to:
- Use a wrong url
- Don’t send authorization
- Send the wrong authorization
- Send a bad request
- With incomplete data
- With the wrong data (i.e. string instead of integer)
- No data at all
- Wrong content-type
- A wonky character here and there
- Post the same data concurrently
- Send a lot of requests in a short period of time
7.1 Reporting
You can develop integrations that use this dataset for reporting, i.e.
- Collecting all errors from the last hour and send them to a specific client
- As a source for uptime monitoring of endpoints
- As input for your business intelligence tool
Feel free to add dynamic data to your monitoring database by updating the ‘User Definable Metrics’ with header syntax, i.e. ${header.orderNumber}. This will add the value of that header whenever the monitoring is triggered. Or use the ‘User Definable Metrics’ to add static information; i.e. an email address, for more specific reporting.
Feel free to contact us with any questions and/or improvements for this guide. Your feedback is really important and appreciated!
Good luck with monitoring exceptions and handling errors on your sflows, making them even more user independent and error free!
8. References
8.1 SQL Monitoring Table Structure
The structure of the SQL table: 19 columns
| Column name | Data type | Extra info |
|---|---|---|
| id | integer | Primary Key, auto increment |
| timestamp | date:time | CET |
| tenant | text | Tenant |
| flow_name | text | Flow name |
| error_message | text | Exception Message with details |
| error_body* | text | Exception responseBody or [null] |
| error_class | text | Exception Class type |
| error_mail | text | User definable field, default [null] |
| error_frequency | text | User definable field, default [null] |
| error_origin | text | ERM (Error Route) or FFM (Route) |
| environment | text | Test or Production |
| breadcrumbid | text | The breadcrumbId of exception origin |
| instance | text | URL of the instance |
| flow_id | text | ID of the flow |
| version | text | User-Agent header |
| intercepted_endpoint | text | The intercepted endpoint of exception origin |
| component_response_time* | integer | Response time in ms or [null] |
| name | text | User definable field, default [null] |
| value | text | User definable field, default [null] |
- ERM: error_body only applicable for HTTP exceptions, otherwise it's
[null] - FFM: component_response_time gets filled with
[null]
Add a SetHeaders component after the step you want to monitor if response time is important, with:
Header Name:Set_ComponentResponseTime
Simple expression:${header.ComponentResponseTime}
8.2 Error responses
8.2.1 Common HTTP response codes
| HTTP Response | Explanation |
|---|---|
| 400 Bad Request | You’ve sent an invalid request, i.e. no required request body or parameter |
| 401 Unauthorised | You’ve failed to authenticate |
| 403 Forbidden | You’ve authenticated but do not have permission to access the requested resource |
| 404 Not Found | You’ve requested a resource doesn’t exist |
| 412 Precondition Failed | One or more request conditions evaluated to false |
| 429 Too Many Requests | The rate limit for calls within a set time frame has been met |
| 500 Internal Server Error | A generic, unspecified error occurred on the target |
| 503 Service Unavailable | The requested service is unavailable |
See wikipedia for an extended list: https://en.wikipedia.org/wiki/List_of_HTTP_status_codes
8.2.2 Types of Error responses
| Error response | Example |
|---|---|
| Response body | {"StatusCode":403,"Message":"This API key has no permission to request this resource", "ValidationErrors":} |
| CamelHttpResponseCode header | 401 |
| CamelHttpResponseText header | Unauthorized |
| Reason header | AuthenticationRequired |
| WWW-Authenticate header | Bearer error="invalid_token", error_description="The access token expired" |
Refer to your endpoint’s documentation or test by trying to break it to get an idea of what kind of error responses.
8.3 Create SQL database (PostgreSQL)
You can use the (PostgreSQL) queries below to create and test the layout of the database table used in this guide. The layout is described in 8.1 SQL Monitoring Table Structure.
8.3.1 Create table
Use this (PostgreSQL) query to create the database.
- Update
YOUR_TABLE_NAMEwith your own value - Observe the creation of your table
CREATE TABLE YOUR_TABLE_NAME (
id SERIAL NOT NULL PRIMARY KEY,
timestamp TIMESTAMP WITHOUT TIME ZONE,
tenant TEXT,
flow_name TEXT,
error_message TEXT,
error_body TEXT,
error_class TEXT,
error_mail TEXT,
error_frequency TEXT,
error_origin TEXT,
instance TEXT,
environment TEXT,
breadcrumbid TEXT,
flow_id TEXT,
version TEXT,
intercepted_endpoint TEXT,
component_response_time INTEGER,
name TEXT,
value TEXT
);
8.3.2 Test insert
Use this (PostgreSQL) query to verify your database has been setup correctly for inserting metrics.
- Update
YOUR_TABLE_NAMEwith your own value - Observe a row inserted with test data
INSERT into YOUR_TABLE_NAME
(timestamp,tenant,flow_name,error_message,error_body,error_class,error_mail,error_frequency,error_origin,environment,breadcrumbid,instance,flow_id,version,intercepted_endpoint,component_response_time,name,value)
VALUES
('2000-01-01 00:00:00','insert','insert','insert',NULL,'insert','insert','insert','insert','insert','insert','insert','insert','insert','insert','0','insert','insert')
8.3.3 Test update
Use this (PostgreSQL) query to verify your database has been setup correctly for inserting metrics.
- Update
YOUR_TABLE_NAMEwith your own value. - Ensure
idmatches the row you've inserted in 8.3.2 Test insert query - Observe the updated
error_bodyfield
UPDATE YOUR_TABLE_NAME SET error_body='update' WHERE id='1'
8.4 Specify User Definable Metrics per flow
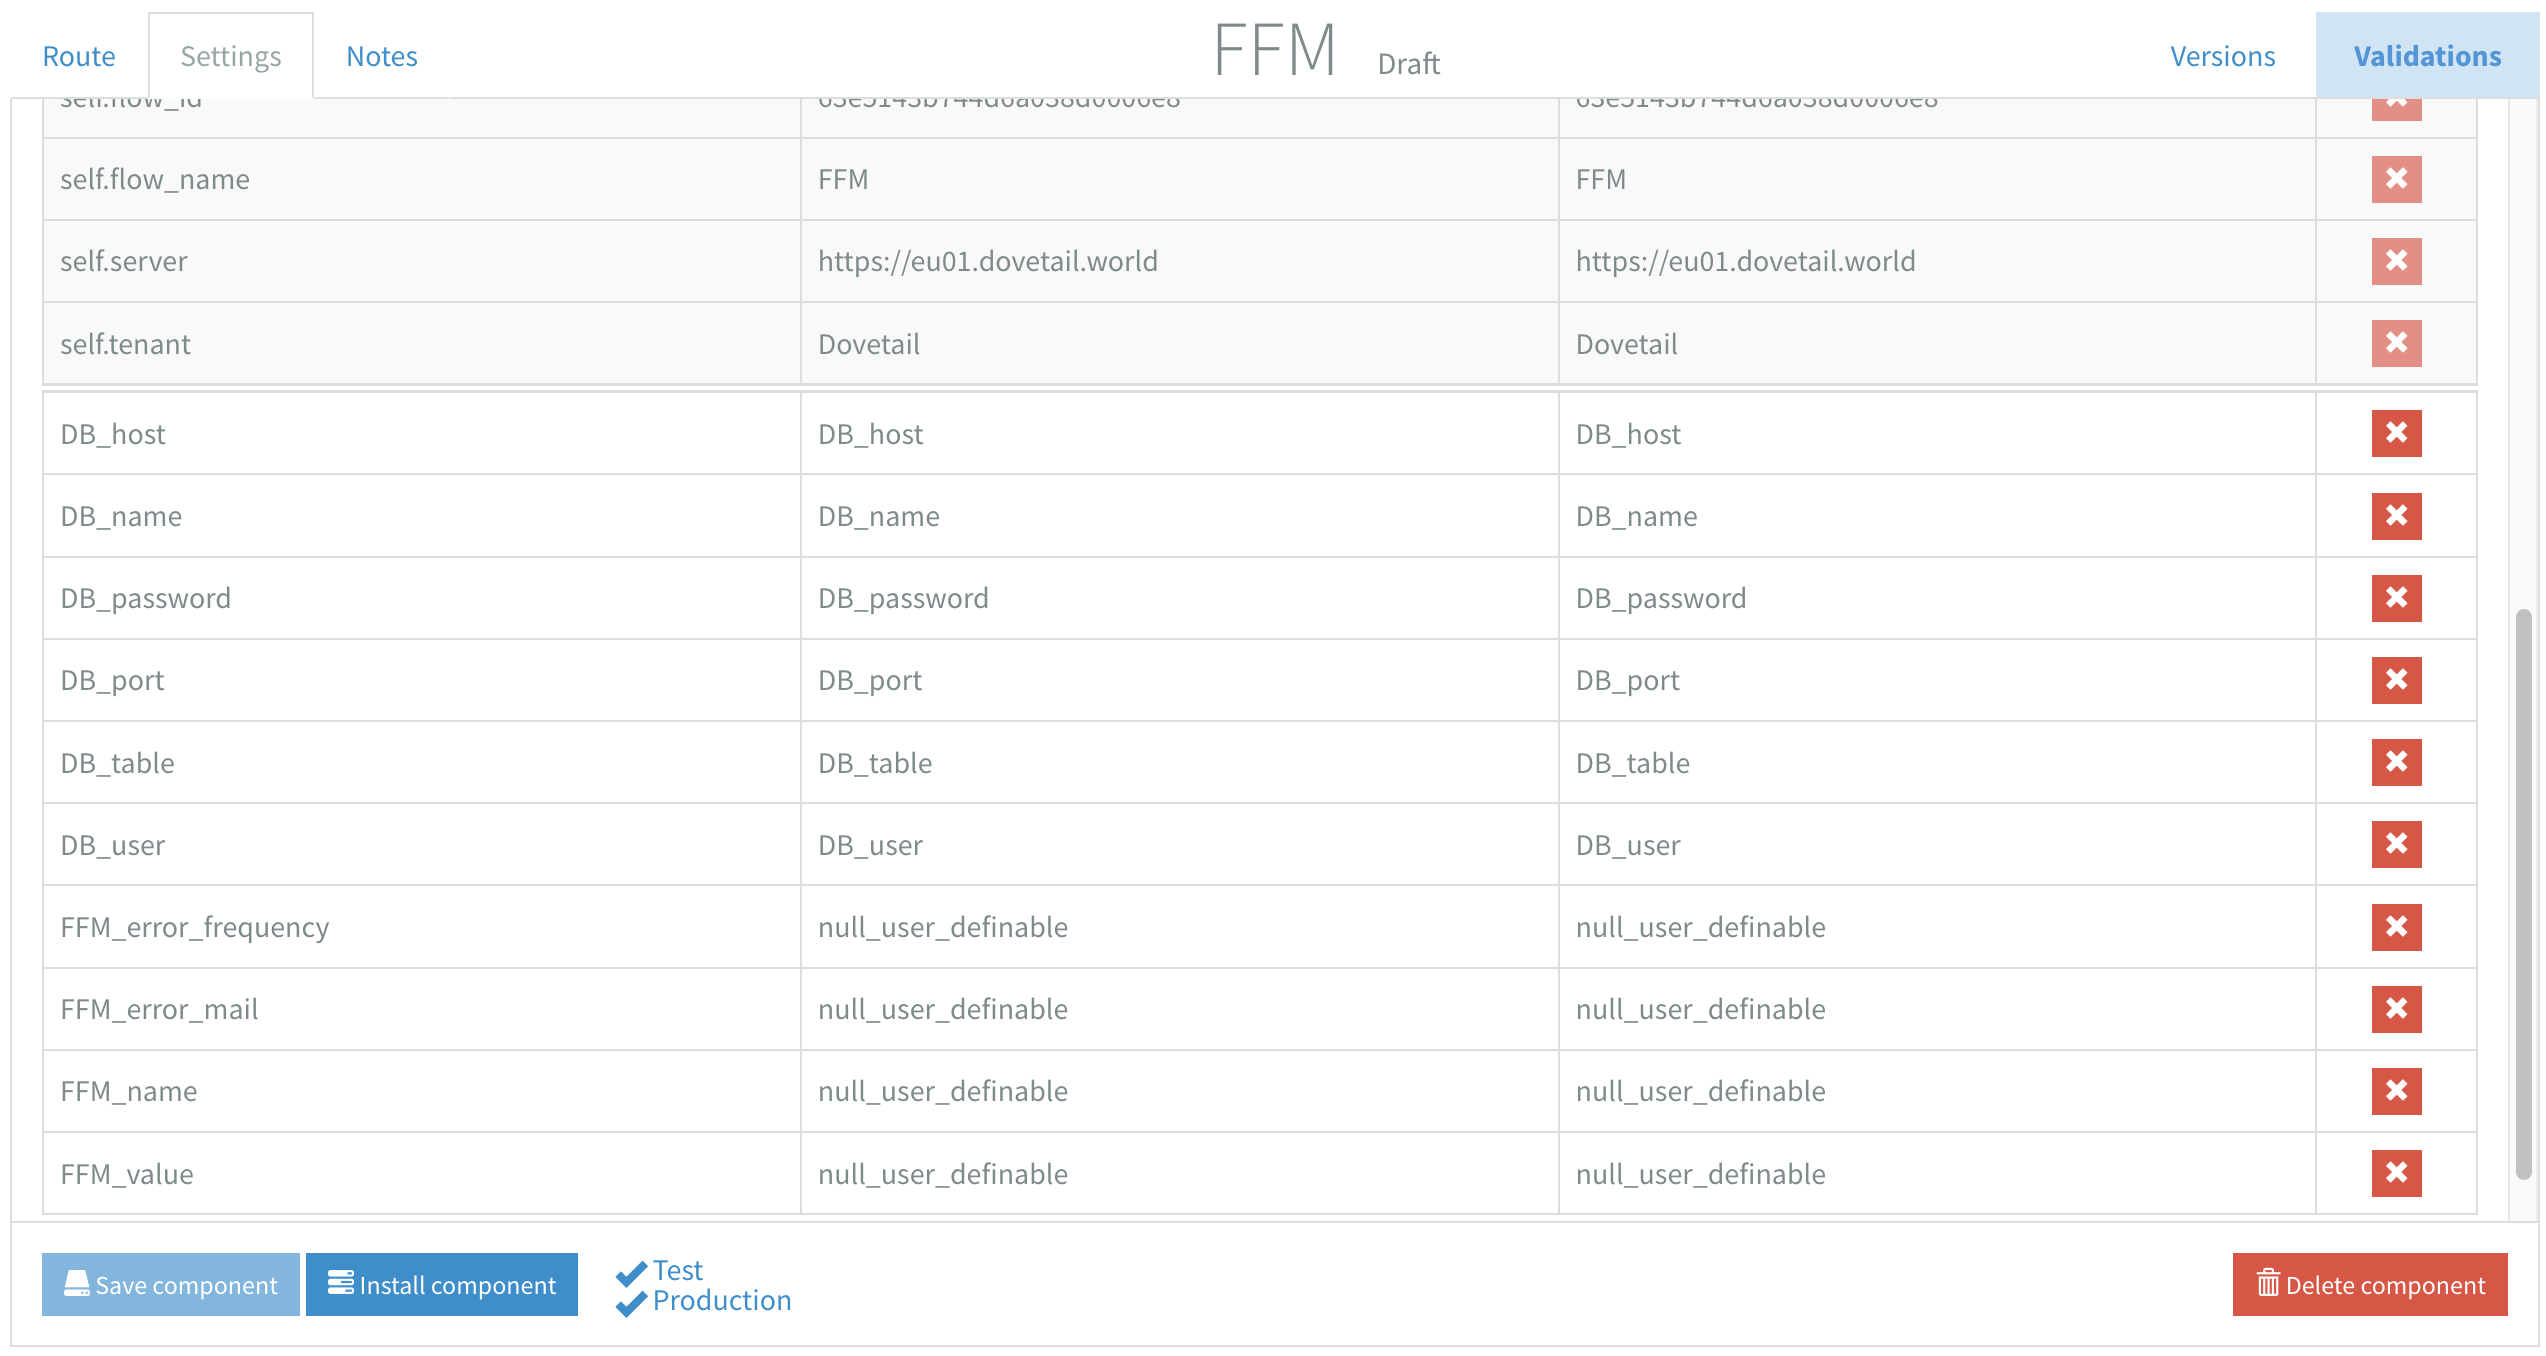
Below you see a screenshot of the Flow variables after you've dragged in an ERM and FFM component. Your database info and credentials will be already filled if you've followed the guide to implement an ERM component or guide to implement an FFM component.
You can alter the variables here if you want them to be different / specific for a flow. Alternatively you can fill them with headername syntax, i.e. ${header.orderNumber} to use the header value at that specific point of the flow.
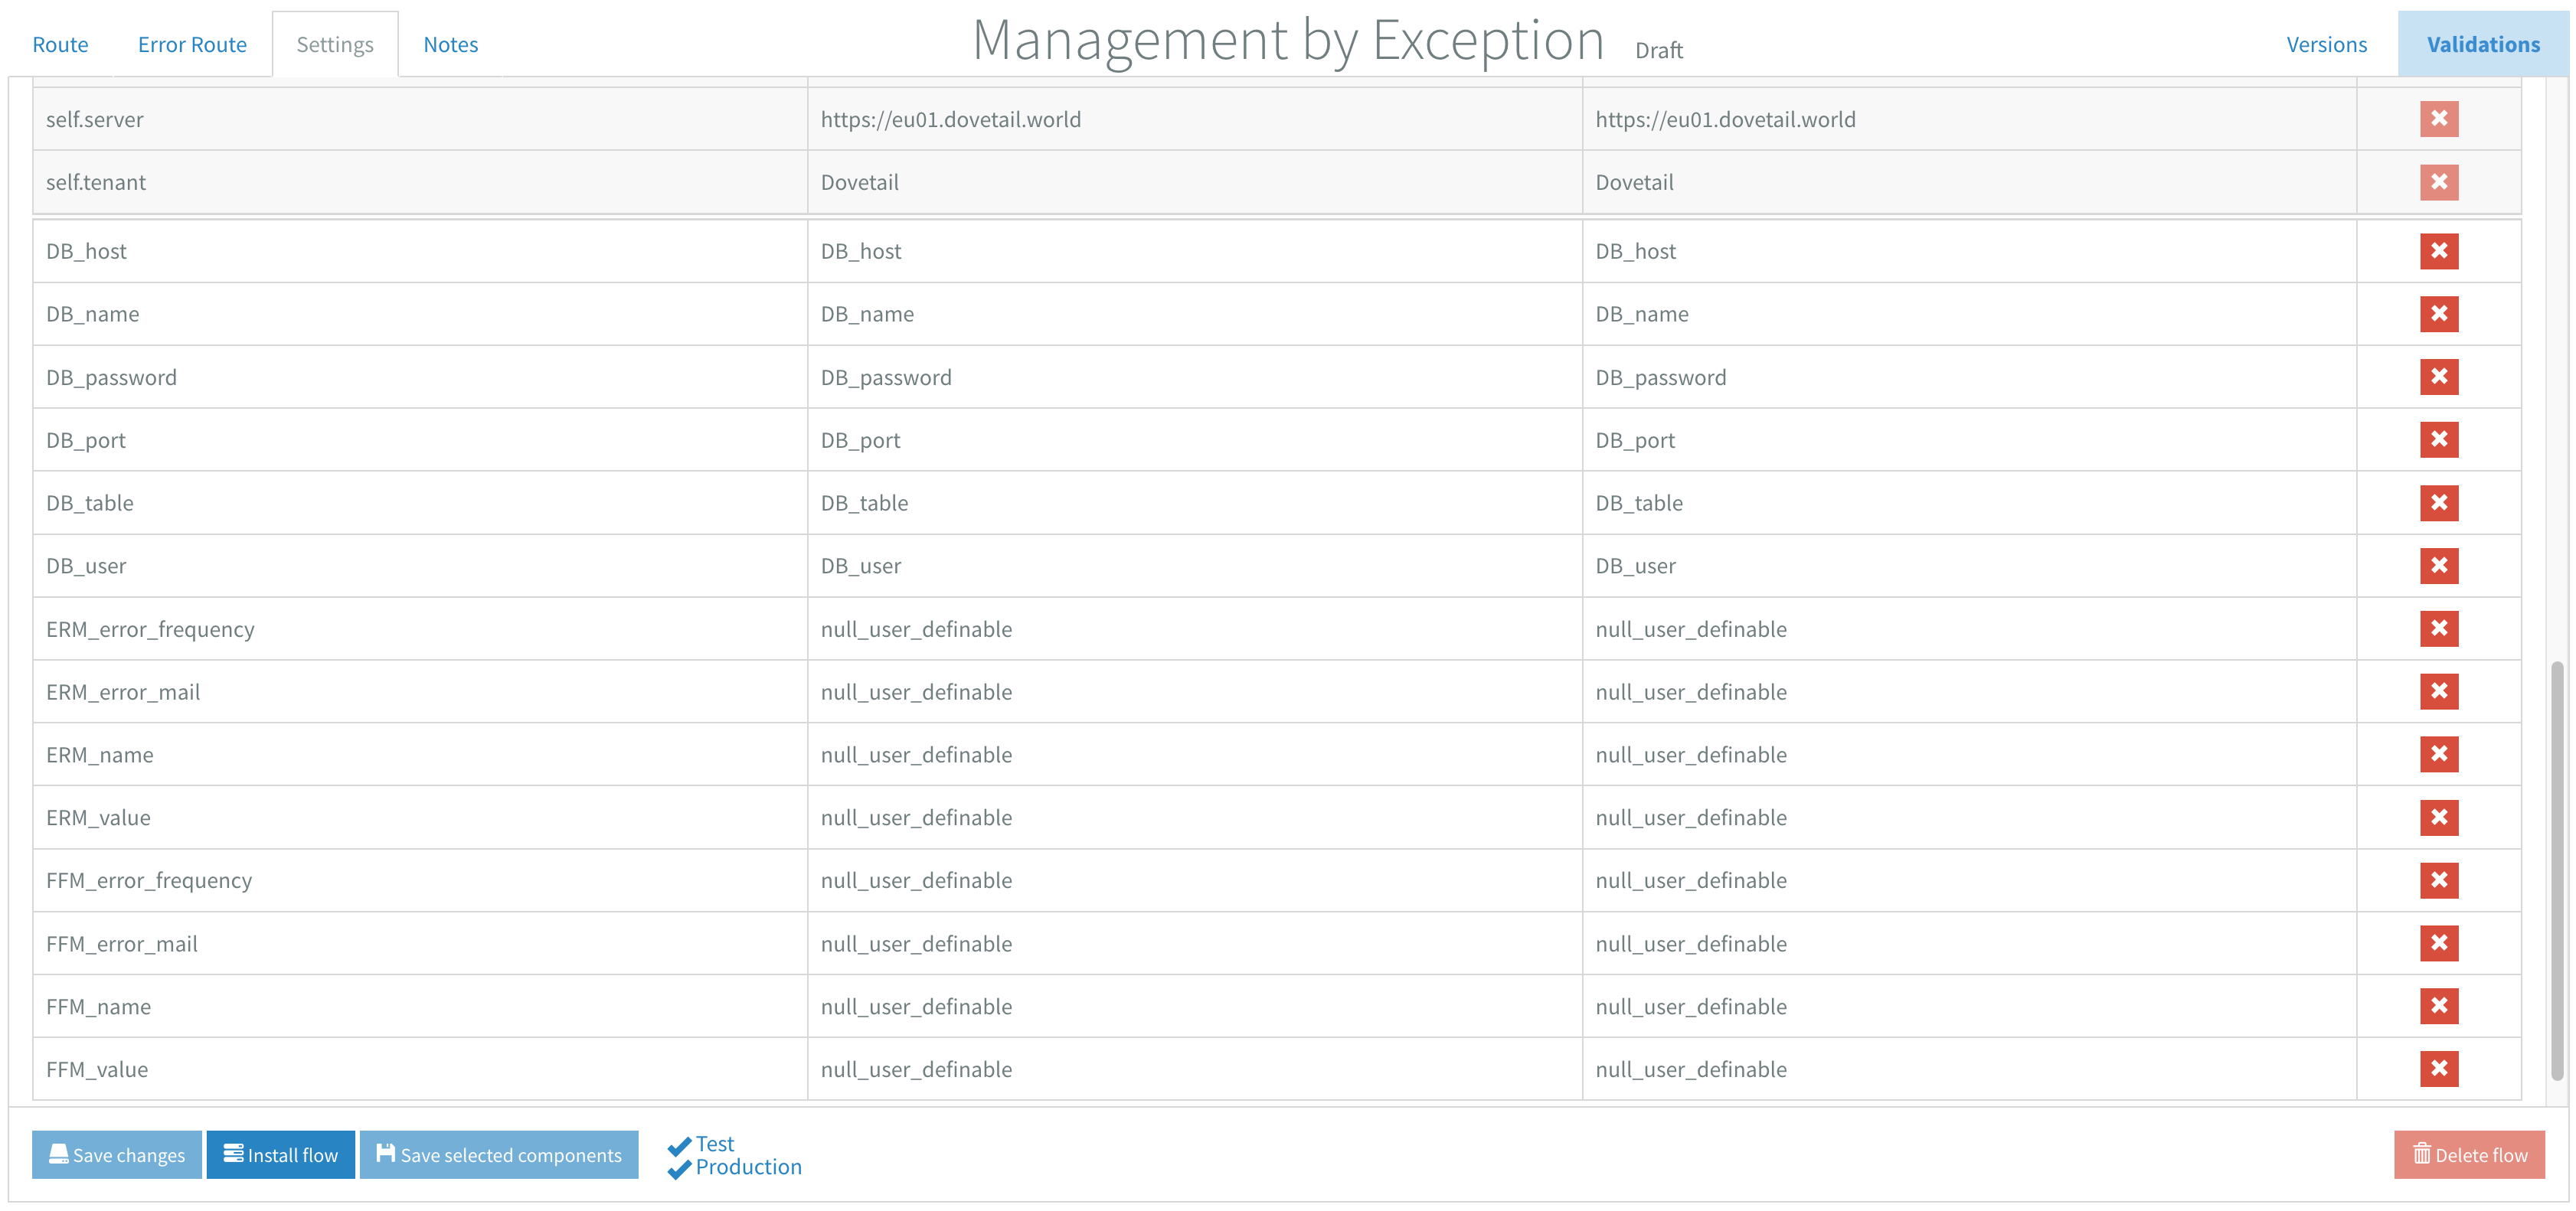
Important!
The null_user_definable values are replaced in the component and inserted in the database as [null].